Learning curves illustrate the relationship between experience and proficiency in acquiring new skills, and at LEARNS.EDU.VN, we are dedicated to simplifying these concepts for learners of all levels. By understanding learning curves, you can optimize your learning strategies, making the process more efficient and enjoyable. Explore our resources at LEARNS.EDU.VN to uncover effective learning methods, skill development techniques, and knowledge retention strategies.
1. What Is a Learning Curve?
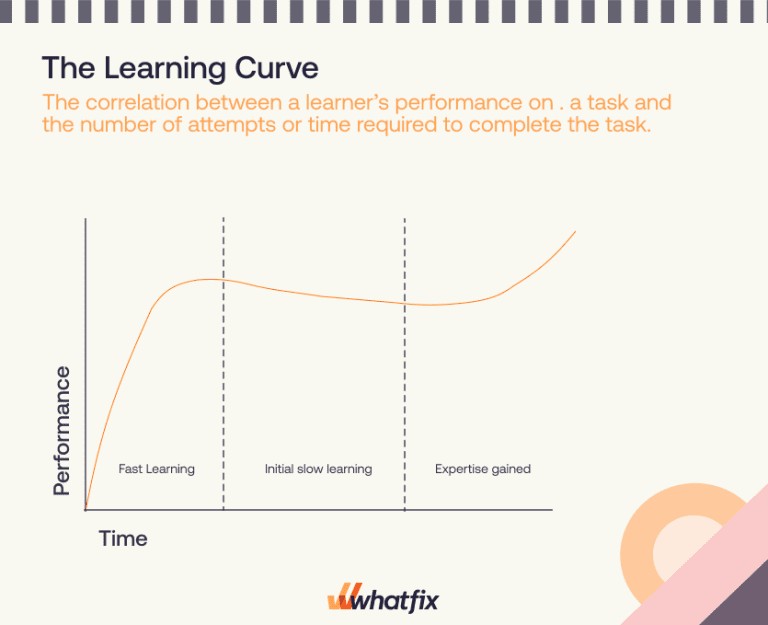
A learning curve represents the correlation between a learner’s performance on a task or activity and the amount of experience, such as the number of attempts or time, required to complete that task. Essentially, it visually demonstrates how proficiency increases with practice. This concept is fundamental in understanding how skills are acquired and mastered. The journey of skill acquisition involves several stages, each characterized by varying rates of improvement and plateaus, as detailed by experts at LEARNS.EDU.VN.
The learning curve shows the connection between a learner’s performance and the experience needed to complete a task.
2. Generalized vs. Measured Learning Curve
Learning curves can be understood in both general and specific quantitative terms, each offering unique insights.
2.1. Generalized Learning Curve
The generalized learning curve is a common way to describe the time it takes to learn a challenging task or skill, and this curve is a qualitative description of how long it takes to acquire a skill. Learning how to ride a bike or becoming proficient in a specific video game are examples. This type of learning curve provides a broad overview of the learning process without precise measurements.
2.2. Measured Learning Curve
Measured learning curves involve defined, mathematical formulas to calculate proficiency or expertise in a task, and skills must be repeatable and measurable to quantify, allowing the examination of a single variable in a skill, task, or process. These curves offer a precise, data-driven analysis of skill acquisition.
3. History of the Learning Curve Theory
The learning curve theory’s roots can be traced back to the late 19th century, evolving through various fields and studies.
3.1. Ebbinghaus Forgetting Curve
Dr. Hermann Ebbinghaus first proposed the idea of a learning curve in 1885 while developing his forgetting curve theory. His theory aimed to understand how people retain and lose information, helping organizations understand when and why we lose information and how we can fight this knowledge loss. This laid the groundwork for understanding how memory and learning are intertwined.
3.2. General Experimental Psychology
In 1934, Arthur Bills explored the learning curve concept in his paper General Experimental Psychology, describing it as a graphical representation of understanding efficiency improvement rates on a given task or practice. Bills presented two types of learning curve graphs: one showing an increase in productivity as time progressed and the second a declining curve showing the time needed to perform a task.
3.3. Wright’s Experience Curve
In 1936, T.P. Wright developed the foundation for the modern learning curve formula, which he termed the “Cumulative Average Model” (also known as “Wright’s Model”) in his paper Factors Affecting the Cost of Airplanes. Wright noted that the cost of building airplanes decreased as production performance and efficiency increased. While many variations of the learning curve model exist today, this is the original formula’s foundation.
3.4. Modern Application for Employee L&D
The learning curve theory is based on the concept that there is an initial period where the amount invested in learners is more significant than the return. However, after overcoming the learning curve, the return is much greater than the investment. The idea here is that the more an employee practices a task, the better they become at it, which translates to a lower cost of training and higher output over time. The learning curve model helps track training progress, improve productivity, and predict learners’ performance and improvement over time.
4. What’s the Learning Curve Formula?
The learning curve theory’s original formula is expressed as: Y = aX^b, with each component playing a vital role:
- Y = The total average time to perform the task per unit or batch
- a = Time taken to perform task initially
- X = The total units of production or times task completed.
- b = Represents the learning curve function slope
The overall theory of the learning curve formula says that as the number of times a person attempts a task increases, the overall amount of time to complete the task will decrease. The learning curve formula can then predict how a person can learn a task. However, the relationship between the time spent practicing an activity and overall performance is not linear. There will always be specific periods for each activity where a small amount of practice would yield massive output improvement, or even minor improvements may require many work hours. This variance in the relationship between training and proficiency over time is known as the ‘learning curve.’
5. Types of Learning Curve
Depending on the task or process, there are four main types of learning curve progression models, and each model provides unique insights into the learning process.
5.1. Diminishing-Returns Learning Curve
In the diminishing-returns learning curve, the rate of progression increases rapidly at the start of learning and decreases over time. This can describe tasks that are easy to learn and rapidly progressing skills, and activities that follow a diminishing returns learning curve are more straightforward when measuring and predicting how the workforce’s performance and output will change over time. Once a learner obtains full proficiency in a task, the progression levels off (called a plateau), and the learner no longer improves his time-to-completion rates. This is either due to maximizing task efficiency or fatigue having set in.
5.2. Increasing-Returns Learning Curve
In the increasing-returns curve, the rate of progression is slow at the start and rises over time until full proficiency is achieved. This describes tasks that are difficult to pick up and have slow skill acquisition rates.
No action items are required here in terms of decision-making, as the initial cost of slow learning is quickly returned upon reaching the high-efficiency phase. However, if the rest of the data shows that the task should not take very long for employees to learn, this graph indicates that you should modify your employee training methods.
5.3. S-Curve
The “S” curve model, also known as the increasing-decreasing return learning curve model, is the most commonly cited type of learning curve model, and it represents learners entirely new to a task. The bottom of the curve represents how learners are slow to perform a new task initially and have slow improvement progression. However, as learners complete a task over time, they take less and less time to complete it and experience a rapid improvement in proficiency until the skill is acquired, at which point performance (and the learning curve) flatten. This represents an overall plateau that has been reached in terms of maximum task efficiency or a new challenge has emerged acting as a barrier to improvement.
5.4. Complex Curve
The complex learning curve is designed to model and map more complicated learning patterns on the way to task mastery and requires more detailed progression tracking. This suggests that the measured task is challenging to learn and takes a certain amount of practice before a learner can become proficient.
The five stages of the complex learning curve are:
- Stage 1 – indicates a slower initial learning phase.
- Stage 2 – shows a productivity increase, indicating that the learner is becoming more proficient.
- Stage 3 – indicates that the learner is plateauing in their proficiency once they have reached a certain mastery of the skill.
- Stage 4 – represents that the learner realizes there is still room for improving the skill and performance again increases.
- Stage 5 – this stage is also known as “overlearning”, where a skill becomes automatic, muscle memory for the learner.
The complex learning curve model looks different for each activity, individual, or group. When learning tasks with complex learning curves, learners often encounter multiple peaks and plateaus.
6. Advantages and Disadvantages of the Learning Curve
The learning curve model offers valuable insights but also has limitations that should be considered when applied in real-world scenarios.
6.1. Pros of the Learning Curve Model
The learning curve model provides several significant benefits for organizations and individuals alike.
- Cost reduction as efficiency increases: As employees or processes become more experienced and efficient, the time taken to complete tasks often decreases, reducing labor costs. Furthermore, with experience, there’s a better understanding of optimizing resource usage and minimizing waste, contributing to lower production costs.
- Improved output quality: With increased experience, workers better understand their tasks and processes. This enhanced knowledge and skill lead to a decrease in errors and defects, resulting in higher quality products or services. The learning curve allows for refining techniques and processes, enhancing overall quality.
- Skill development: The learning curve model emphasizes continuous improvement and a culture of learning. As workers become more skilled, they become more valuable assets to their organization. This model also supports the idea of ongoing training and skill development, ensuring that employees are always up-to-date with the latest techniques and technologies in their field.
- Predictable performance metrics: The learning curve model helps establish predictable performance improvement patterns and allows L&D leaders to measure training effectiveness over time. This predictability is valuable for planning and forecasting. Organizations can use historical data to predict how long it will take for new employees to become proficient or to implement new processes fully and efficiently.
- Risk mitigation: With experience, organizations learn to identify and avoid potential risks and pitfalls. The learning curve allows them to develop strategies and contingency plans based on past experiences. This knowledge helps mitigate risks associated with new projects or introducing new processes, as the organization becomes more adept at foreseeing and managing potential issues.
6.2. Cons of the Learning Curve Model
Despite its advantages, the learning curve model has certain limitations that should be taken into account.
- Limited application: The learning curve model is most effective in environments where tasks are repetitive and consistent over time. In industries or job roles where tasks are highly variable or require significant creative or adaptive work, the benefits of the learning curve may be less pronounced. For instance, in artistic or research-based fields, efficiency, and productivity improvement over time may apply less than in manufacturing or routine service tasks.
- Doesn’t account for multiple variables: Using the learning curve model to predict performance and skill acquisition for larger groups (like in large workforces) means that assumptions are made about variables like learner motivation, sociological factors, workplace dynamics, L&D resources, and previous subject matter knowledge or task experience.
- Additional analysis might be required: If a learning curve model fails to show the expected results (ie. task improvement over time), additional analysis would be required to identify and isolate other variables impacting learning outcomes.
7. Examples of the Learning Curve Theory in the Workplace
The learning curve theory has practical applications across various workplace scenarios, enhancing efficiency and productivity.
7.1. Project Management
With project management, teams become more proficient by processing repeated tasks or similar projects. Initially, a project may take longer and involve more resources due to unfamiliarity or unanticipated challenges. However, as the team gains experience, they develop more efficient processes, problem-solving skills, and a deeper understanding of the project requirements. This leads to reduced time and cost in subsequent projects.
7.2. Manufacturing
The learning curve can track its workforce’s performance with its manufacturing costs by replacing “performance” and “number of attempts” with total production in units or cost per unit. As time progresses, workers will produce more, and the “per-unit” cost will decrease. Organizations can predict this reduction in per-unit cost by modeling the change with the learning curve. This is done by considering labor costs and employee training and will impact the cost of a good or service. Initially, the product may reach the market at a higher price point because of the high per-unit cost to produce a good. Over time, this will decrease as the workforce’s efficiency increases.
7.3. Employee Training
When onboarding and training new employees, L&D teams are tasked with accelerating the time-to-productivity for new hires. With the learning curve model, organizations can measure the amount of time different tasks and processes take to master, allowing business operations teams to forecast company growth better and enable employees to succeed in new roles.
7.4. Technology Adoption
Introducing new technology in an organization typically involves multiple learning curves. Let’s look at technology adoption from an enterprise perspective, specifically implementing a new technology like a CRM or ERP. Initially, employees may struggle using the new systems and incorrectly use the software’s workflows, reducing productivity and potentially leading to internal resistance to change. With enterprise software being highly complex and custom-built for business requirements, employees start from square one. Their only experience may be with similar tools and tasks, but not with the ones they’re now learning. It presents a significant barrier to change management that involves overcoming a complex learning curve.
Over time, as they become more familiar with the technology, their proficiency improves, leading to increased productivity, innovation, and often a competitive advantage. This occurs when organizations achieve digital adoption, where employees (or application end-users) efficiently complete tasks, enabling organizations to achieve the intended business outcomes of a technology implementation and maximize their digital transformation ROI.
7.5. Healthcare and Medicine
In healthcare, the learning curve can be applied to various aspects, such as surgical procedures, diagnosis methods, and patient care techniques. For instance, surgeons may take longer to perform a particular procedure initially, but their speed and efficiency improve as they repeat it, often leading to better patient outcomes. Similarly, healthcare professionals become more adept at using new medical technologies or treatment protocols with experience.
The learning curve is also accelerated as surgeons and other healthcare leaders master procedures and skills, allowing them to take a “train-the-trainer” approach to their instructors to help identify new resources to create, learning methods to use, types of assistance required, and identify friction points in the process.
8. How to Accelerate the Learning Curve
Accelerating the learning curve can significantly enhance training effectiveness and skill acquisition. L&D teams and educational instructors can accelerate the learning curve with the right approach and application.
8.1. Define Your Unit of Output
Set long and short-term measurable outcomes to evaluate employee performance, training effectiveness, and task mastery. Make the purpose of your training program clear by identifying what employees are expected to accomplish by the end of training.
8.2. Efficient Onboarding
To help a new hire acquire competence and remain confident in their role, be sure to create an efficient onboarding process. A strong onboarding process provides newly hired team members with the right information, training, and tools during their first few weeks at a company, making their learning curve more productive and much shorter in the future.
8.3. Personalized Training
Create personalized learning programs with training content tailored according to individual job roles and learning types. Personalized learning drives employee engagement, improves training effectiveness, accelerates time-to-proficiency, and accelerates the learning curve.
8.4. Make Informed Decisions
If the data from the learning curve shows that the current training process is not working, explore alternative employee training methods and implement other modifications to fine-tune your training programs. It might take a few rounds of trial and error to find the right change that improves performance.
8.5. Mentor Coaching
Often no matter how well a formal employee training program is structured, it does not impart all of the knowledge and information employees need to perform their roles effectively. This is when real-life coaching from an experienced professional – a supervisor, mentor, or veteran employee – can be effective to acquire knowledge in real-time.
8.6. Invest in Training Technology
More organizations are leveraging employee training software to implement effective training with personalized learning content that uses user analytics to help shorten the learning curve across employees. There are a few different types of employee training software that can be leveraged for creating and managing employee training programs.
8.7. Establish Time Frame
To shorten the learning curve, you must establish a time frame for achieving the set of desired outcomes to understand whether or not your training methods are providing the expected results. For example, new hires should be able to create and manage leads and accounts on a company’s CRM platform after completing a 3-week CRM training program.
8.8. Continuous Monitoring
The learning curve theory shouldn’t only be applied during times of change or when training difficulties arise; instead, monitor the learning curve year-round. Continuous monitoring uncovers problems as soon as they appear, allowing you to easily correct and modify your approach as required.
9. Learning Clicks Better With LEARNS.EDU.VN
At LEARNS.EDU.VN, we empower learners to overcome steep learning curves associated with complex software applications and digital processes through role-based guidance and real-time support. Our platform offers tools and resources designed to make learning more efficient and effective.
With LEARNS.EDU.VN, organizations can empower their employees with:
- Sandbox application environments to provide simulated, hands-on training without risking live software usage.
- Guided Flows that walk employees step-by-step through complex workflows, new processes, and infrequently done tasks.
- Onboarding Tours and Task Lists that enable employees to reduce their time-to-proficiency on essential tasks and software.
- Contextual Smart Tips that provide additional information and nudges end-users to take specific action.
- Pop-Ups and Beacons that alert end-users to new updates, process changes, new features, or team announcements.
- Field Validation that ensures data is entered correctly, in the right format.
- Self Help that provides real-time performance support for employees right inside their applications.
- Guidance Analytics that track how employees engage, consume, and use guidance and support. Understand who is completing Task Lists, the impact Smart Tips are having on core metrics like time-to-completion, and what the most searched Self Help queries are.
10. FAQs About Learning Curves
Here are some frequently asked questions about learning curves to help you better understand the concept.
10.1. What is the basic definition of a learning curve?
A learning curve illustrates the rate at which someone acquires a new skill or information over time, typically showing improvement with increased experience.
10.2. How can the learning curve be applied in employee training?
In employee training, the learning curve helps in measuring the time and effort required for employees to master new tasks, allowing for more effective training programs.
10.3. What are the key factors that affect the shape of a learning curve?
Factors such as the complexity of the task, the learner’s prior knowledge, motivation, and the quality of training can all influence the shape of a learning curve.
10.4. Can a learning curve predict future performance?
Yes, learning curves can be used to predict future performance by analyzing past progress and identifying trends in skill acquisition.
10.5. What is the significance of the plateau phase in a learning curve?
The plateau phase indicates a period where learning progress slows or stops, often requiring new strategies or approaches to overcome.
10.6. How do different learning styles affect an individual’s learning curve?
Different learning styles can impact the speed and efficiency of learning, influencing the shape and steepness of the learning curve for each individual.
10.7. What role does feedback play in shaping a learning curve?
Feedback is crucial in shaping a learning curve, as it provides learners with insights into their performance and areas for improvement, accelerating skill acquisition.
10.8. How can technology be used to accelerate learning curves?
Technology offers tools like simulations, personalized learning platforms, and immediate feedback systems that can significantly speed up the learning process.
10.9. What are the ethical considerations when using learning curves in performance evaluation?
Ethical considerations include ensuring fairness, transparency, and avoiding undue pressure on learners to perform at unrealistic rates.
10.10. Where can I find more resources to understand and apply learning curves effectively?
LEARNS.EDU.VN offers comprehensive resources and courses to help you understand and apply learning curves in various contexts.
By understanding the nuances of learning curves, you can unlock your full learning potential. Visit LEARNS.EDU.VN today to explore our resources and begin your journey toward mastery. Whether you’re a student, professional, or lifelong learner, our platform is designed to help you succeed.
Ready to transform your learning experience? Contact us today!
Address: 123 Education Way, Learnville, CA 90210, United States
WhatsApp: +1 555-555-1212
Website: learns.edu.vn