Algorithm 1 provides an overview of our RayBNN framework. Initially, we establish the physical structure of the neural network by assigning 3D positions to glial cells and neurons, as detailed in the “Cell location assignment and distribution analysis” section. Due to the random nature of cell position assignment, some neurons and glial cells may intersect. We eliminate these intersecting cells using the methods and analysis described in the “Cell collision detection and analysis” section. Subsequently, novel neural connections are ray-traced based on the positions and radii of the cells. The “Forming neural connections via raytracing” section outlines the specialized ray tracing algorithms employed to create these connections. Each neural connection within the network is then encoded into a sparse weighted adjacency matrix, as explained in the “Mapping neural connections into the weighted adjacency matrix” section. Concurrently, the “Universal activation function” section details the implementation of the Universal Activation Function (UAF) for each neuron. The forward pass, utilizing this weighted adjacency matrix, calculates the neural network’s output, as described in the “RayBNN forward pass” section. Conversely, the backward pass generates the gradient of the weights, which is then applied by gradient descent algorithms to update the weighted adjacency matrix, as detailed in the “Backpropagation” Section. During transfer learning, changes in the dataset necessitate modifications to the number of neurons and neural connections. If required, neural connections are removed as described in the “Deleting neural connections” Section, and any redundant neurons are eliminated according to the “Deleting redundant neurons” Section.
Algorithm 1
Overview algorithm for RayBNN
Cell location assignment and distribution analysis
Hidden neurons and glial cells’ location assignment
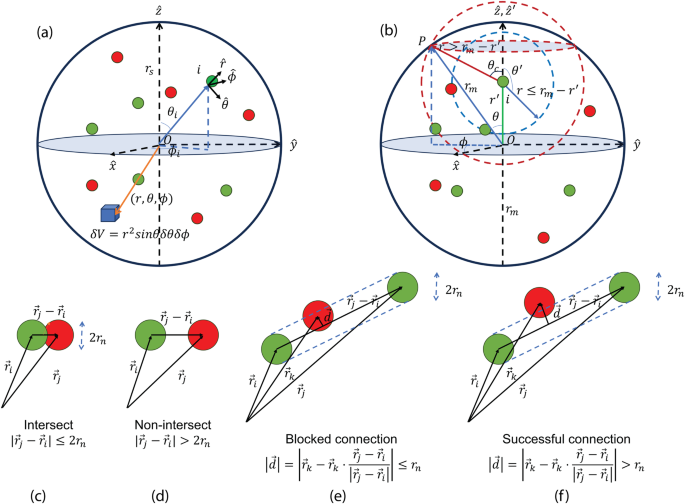
In our 3D ray traced biological neural network learning model, hidden neurons and glial cells are distributed uniformly within a network sphere of radius *rs. To achieve this uniform distribution, we establish a spherical coordinate system at the sphere’s origin, with unit vectors ((hat{r},hat{theta },hat{phi })) denoting the radial, polar, and azimuthal directions, as illustrated in Fig. 6a. Ideally, every small volume (delta V={r}^{2}sin theta delta rdelta theta delta phi) centered at (r, θ, ϕ) within the sphere should contain an equivalent number of cells, accounting for minor statistical variations. To assign the location of a cell i, we first generate three random numbers ({{{{{{{{mathcal{R}}}}}}}}}_{r}), ({{{{{{{{mathcal{R}}}}}}}}}_{theta }), and ({{{{{{{{mathcal{R}}}}}}}}}_{phi }), each uniformly distributed between 0 and 1. The position of cell i, denoted as (ri, θi, ϕi*), is then determined using the formulas:
$${r}_{i}={{{{{{{{mathcal{R}}}}}}}}}_{r}^{1/3}{r}_{s}$$
(1)
$${theta }_{i}={cos }^{-1}[2times ({{{{{{{{mathcal{R}}}}}}}}}_{theta }-0.5)]$$
(2)
$${phi }_{i}=2pi times {{{{{{{{mathcal{R}}}}}}}}}_{phi }$$
(3)
Fig. 6: Visualization of the ray-tracing method in a 3D biological neural network model.
a Depiction of the global spherical coordinate system ((hat{r},hat{theta },hat{phi })) centered at the origin of the network sphere with radius *rs. A small cube at position (r, θ, ϕ) has a differential volume of (delta V={r}^{2}sin theta delta theta delta phi). Neurons (green) and glial cells (red) are uniformly distributed, resulting in a parabolic cell density distribution radially. b Setup for neural connection probability calculation in RT-3. Cluster spherical coordinate origin O is at the center of the cluster sphere (radius rm). Neuron i‘s local spherical coordinate (({hat{r}}^{{prime} },{hat{theta }}^{{prime} },{hat{phi }}^{{prime} })) is neuron-centered. Coordinates are aligned with (hat{z}) and ({hat{z}}^{{prime} }) parallel to the line between i and O. Sub-cluster sphere (neuron i-centered) accessibility within cluster sphere varies by distance r. c Neuron intersection occurs if distance (| {vec{r}}_{j}-{vec{r}}_{i}| le 2{r}_{n}). d Non-intersecting neurons: (| {vec{r}}_{j}-{vec{r}}_{i}| > 2{r}_{n}). e Connection blockage by a third cell k: distance to connection (| vec{d}| le {r}_{n}). f Successful connection formation: (| vec{d}| le {r}_{n}) and cell k is between neurons i and j*.
To confirm the uniformity of cell location assignment within the sphere at a constant density ({eta }_{T}=frac{{N}_{T}}{{r}_{s}^{3}4pi /3}), where *NT = Nn + Ng is the total count of neurons (Nn) and glial cells (Ng), we examine the population density function of cells nT(r) on a sphere surface of radius r*, concentric with the network sphere. This function is found to be:
$${n}_{T}(r)={eta }_{T}4pi {r}^{2}=frac{3{N}_{T}}{{r}_{s}^{3}}{r}^{2}.$$
(4)
As illustrated in Fig. 2 and discussed previously, the parabolic relationship of the population distribution is validated.
Input and output neurons assignment
In our 3D ray traced biological neural network learning model, all output neurons are positioned at the center of the network sphere, whereas input neurons are located on the sphere’s surface. Input data features often exhibit correlation and order. Consequently, input neurons on the sphere’s surface should maintain this order and be equally spaced. For instance, an image with (*Nx, Ny) pixels requires preservation of its 2D order. To accommodate this, we developed the following input neuron assignment scheme. We first create a Nx × 1 vector ({vec{V}}_{theta }={[{v}_{theta }^{1},ldots,{v}_{theta }^{i},ldots,{v}_{theta }^{{N}_{x}}]}^{T}) and a Ny* × 1 vector ({vec{V}}_{phi }={[{v}_{phi }^{1},ldots,{v}_{phi }^{j},ldots,{v}_{phi }^{{N}_{y}}]}^{T}) where elements are equally spaced from 0 to 1:
$$left{begin{array}{rclr}{v}_{theta }^{i}&=&frac{i+1}{{N}_{x}+1}&(i=0,ldots,{N}_{x}-1)\ {v}_{phi }^{j}&=&frac{j+1}{{N}_{y}+1}&(j=0,ldots,{N}_{y}-1)end{array}right.$$
(5)
As depicted by the black dots in Fig. 1c, the location of the input neuron corresponding to the (i, j) pixel of an image can be mapped onto the sphere using:
$$left{begin{array}{l}{r}_{i,j}={r}_{s}\ {theta }_{i,j}=co{s}^{-1}[2times ({v}_{theta }^{i}-0.5)]\ {phi }_{i,j}=2pi {v}_{phi }^{j}end{array}right.$$
(6)
Each input neuron occupies an equal solid angle (delta {{{{{{{rm{{{Omega }}}}}}}}}}=frac{4pi }{{N}_{x}{N}_{y}}) and thus an equivalent area on the sphere’s surface, ensuring unbiased access to the uniformly distributed hidden neurons below. This method preserves the original pixel order and correlation. Furthermore, input neurons can be readily mapped to 1D data while maintaining feature order. For 1D, N1D-point EEG data, we construct ({vec{V}}_{theta }) and ({vec{V}}_{phi }) with ({N}_{x}={N}_{y}=lceil sqrt{{N}_{1D}}rceil) and flatten the 2D neuron location into a 1D vector (vec{A}) using a helix pattern (vec{A}={[left((0,0)right.,(0,1),ldots,(0,{N}_{y}-1),(1,0),(1,1),ldots,(1,{N}_{y}-1),ldots ]}^{T}), illustrated by the blue line in Fig. 1c.
For 3D ordered data like RGB images, red, blue, and green pixels can be assigned to the same location. When a hidden neuron connects to this location, it randomly selects one of the three neurons to connect with.
If input features are unordered, input neuron location assignment simplifies. Neurons can be randomly placed on the surface using the same method as hidden neurons, but with radial coordinates fixed at *r*s.
Cell location re-assignment upon population growth
During knowledge transfer between datasets, dataset dimensions and the number of inputs can change. Increased dimensions necessitate adding more input and output neurons, as well as potentially increasing hidden neurons and glial cells to manage new dataset complexity. In such cases, the network sphere expands to ({r}_{s}^{{prime} }) to maintain a low collision rate. To achieve this, we relocate existing cells to the new sphere by adjusting their radial position to ({r}_{i}^{{prime} }=frac{{r}_{s}^{{prime} }}{{r}_{s}}{r}_{i}), preserving polar and azimuthal angles. New cells are then added to the expanded sphere using the same procedure. Similarly, input neurons on the sphere surface can be increased in an ordered pattern based on dataset changes. For example, transitioning from low to high-resolution images allows densifying ({vec{V}}_{theta }) and ({vec{V}}_{phi }) by inserting new elements evenly. New neurons (red dots in Fig. 1d) are located using new vector elements, while old input neurons remain in place without reconnection. Alternatively, concatenating new features can be accommodated by moving old neurons, for example, northward on the sphere (Fig. 1e), recalculating ({theta }_{i}^{{prime} }=co{s}^{-1}[2times (kappa {v}_{theta }^{i}-0.5)]) with connections to hidden neurons preserved. Here, 0 < κ ≤ 1 is a densification factor controlling space allocation for new neurons in the south. New input neurons can then be added, for instance, in the southern sphere region vacated by the old neurons.
Cell collision detection and analysis
During cell location assignment in our 3D biological neural network learning model, collisions may occur. We address this by removing any colliding cells during the assignment process, maintaining a collision rate below 1% for computational efficiency. This requires the network sphere radius to exceed a minimum radius *rs,min, ensuring sparse cell density. As shown in Fig. 6c and 6d, a collision at ri occurs if another cell’s center is within a distance of 2rn. Given that cells are uniformly distributed and rs ≫ 2rn, we can consider a new spherical coordinate (({hat{r}}^{{prime} },{hat{theta }}^{{prime} },{hat{phi }}^{{prime} })) centered at cell i. Neglecting cells within 2rn* of the network sphere surface, the population density function at ({r}^{{prime} }) approximates Eq. (4), ({n}_{T}({r}^{{prime} })=frac{3{N}_{T}}{{r}_{s}^{3}}{{r}^{{prime} }}^{2}). Thus, the collision probability can be expressed as:
$${P}_{c}=intnolimits_{0}^{2{r}_{n}}{n}_{T}({r}^{{prime} })d{r}^{{prime} }=8{N}_{T}frac{{r}_{n}^{3}}{{r}_{s}^{3}}=frac{32pi }{3}{eta }_{T}{r}_{n}^{3}$$
(7)
This equation holds true when *Pc ≪ 1. To maintain a preset minimum collision threshold Pc,th*, the cell density must satisfy:
$${eta }_{T} < frac{3{P}_{c,th}}{32pi {r}_{n}^{3}}$$
(8)
and the sphere radius:
$${r}_{s} > {left(frac{8{N}_{T}}{{P}_{c,th}}right)}^{frac{1}{3}}{r}_{n}$$
(9)
Equation (7) can be interpreted as follows: In a network sphere of radius *rs and volume ({V}_{s}=frac{4pi }{3}{r}_{s}^{3}), with sufficiently sparse cell density, cell intersection occurs when a cell falls within the volume ({V}_{n}=frac{4pi }{3}{(2{r}_{n})}^{3}) occupied by another cell. The probability of a single cell intersecting is ({P}_{c}={N}_{T}{V}_{n}/{V}_{s}=frac{32pi }{3}eta {{r}_{n}}^{3}). For NT cells, the total intersected cells is Nc = NTPc*, resulting in a collision rate (frac{{N}_{c}}{{N}_{T}}={P}_{c}), consistent with Eq. (7).
Forming neural connections via raytracing
We implemented three distinct ray tracing (RT) algorithms to establish connections between neurons in our 3D biological neural network learning model.
RT Algorithm 1 (RT-1): Randomly Generated Rays. Each neuron randomly emits K rays at random angles and infinite lengths. K is set higher than the expected number of connections per neuron, typically K = 10,000 to ensure sufficient connections. For *Nn neurons, KNn rays are generated. Rays intersecting glial cells are discarded. If a ray intersects multiple neurons, a connection is formed from the originating neuron to the closest intersected neuron, with subsequent neurons along the ray path disregarded for connection. Intersection detection involves checking if any cell’s distance to a ray is within rn. Rays intersecting neurons (but not glial cells) are queued, and duplicate connections are removed using a deduplication algorithm. RT-1 requires KNn(Nn + Ng*) comparisons, which is inefficient due to redundant intersections and rays missing targets.
RT Algorithm 2 (RT-2): Directly Connected Rays. Each neuron is directly connected to every other neuron via finite-length rays, generating ({N}_{n}^{2}) rays. These rays are compared against *Nn + Ng* neurons and glial cells. Similar to RT-1, glial cell intersections remove rays, and multi-neuron intersections terminate at the nearest neuron. RT-2 also uses the same intersection and deduplication algorithms. With ({N}_{n}^{2}({N}_{n}+{N}_{g})) comparisons, RT-2 is computationally expensive for large neuron counts, scaling at (O({N}_{n}^{3})).
RT Algorithm 3 (RT-3): Distance-Limited Directly Connected Rays. This algorithm builds upon RT-2 for efficiency, ignoring far-reaching connections. A random cell is selected as a pivot. Connections are considered only within a fixed sphere radius (*rm) around the pivot, encompassing approximately Nm neurons and Ngm glial cells. RT-2 is applied to this segment to generate connections. This process repeats with new pivots, and connections from each segment are concatenated and deduplicated. Each segment involves ({N}_{m}^{2}) rays compared to Nm + Ngm cells, totaling ({N}_{m}^{2}({N}_{m}+{N}_{gm})) comparisons per segment. For K segments, the total comparisons are roughly (K{N}_{m}^{2}({N}_{m}+{N}_{gm})). Given Nn ≫ N*m, RT-3 is significantly faster than RT-2, by a factor of ({({N}_{n})}^{2}/K{N}_{m}^{2}gg 1). To ensure all output neurons connect to all input neurons, we perform a backward network traversal to verify all neural connections.
Neural connection length probability distribution function
This section details the derivation of the neural connection length probability using RT-3 for our 3D ray traced biological neural network learning model. For simplicity, we assume spherical clusters of radius *rm. As shown in Fig. 6b, we use a cluster spherical coordinate ((hat{r},hat{theta },hat{phi })) centered at the cluster sphere origin (O) and a local spherical coordinate ((hat{{r}^{{prime} }},hat{{theta }^{{prime} }},hat{{phi }^{{prime} }})) centered at neuron i, located ({r}^{{prime} } < {r}_{m}) from the cluster center. We align the (hat{z}) axis of both coordinates such that neuron i‘s position is (({r}^{{prime} },0,0)) in cluster coordinates. Figure 6e and 6f illustrate that a connection between neurons i and j (distance r) is blocked by an intervening cell k. Assuming sparse cell density, the probability of blockage is proportional to the number of cells in a cylinder connecting the neurons with radius rn*, leading to a connection probability of:
$$p(r)=1-pi {r}_{n}^{2}{eta }_{T}r$$
(10)
The conditional probability of neuron i forming a connection of length r is:
$${P}_{nc}(r| {r}^{{prime} })={n}_{n}(r)times p$$
(11)
where *nn(r) = nT(r) is the neuron population density at distance r from neuron i*, half the total density (equal neuron/glial cell numbers). For (r , < , {r}_{m}-{r}^{{prime} }) (blue dashed sphere in Fig. 6b), all connecting neurons are within the cluster:
$${n}_{nc}(r| {r}^{{prime} })=4pi {eta }_{n}{r}^{2}(1-pi {r}_{n}^{2}{eta }_{T}r)$$
(12)
For ({r}_{m}-{r}^{{prime} } , < , r , < , {r}_{m}+{r}^{{prime} }) (red dashed sphere in Fig. 6b), only a portion of neurons at distance r are within the cluster and can connect. This portion is estimated using the solid angle of the cluster-internal crust:
$${n}_{nc}(r| {r}^{{prime} })=frac{2pi intnolimits_{{theta }_{c}}^{pi }sin {theta }^{{prime} }d{theta }^{{prime} }}{4pi }4pi {eta }_{n}{r}^{2}(1-pi {r}_{n}^{2}{eta }_{T}r)$$
(13)
$$=pi {eta }_{n}frac{r[{r}_{m}^{2}-{(r-{r}^{{prime} })}^{2}](1-pi {r}_{n}^{2}{eta }_{T}r)}{{r}^{{prime} }}$$
(14)
For (rge {r}_{m}+{r}^{{prime} }), ({N}_{c}(r| {r}^{{prime} })=0) as no neurons qualify within the cluster. Using Bayes’ Theorem, the connection length probability is:
$${P}_{nc}(r)= intnolimits_{0}^{{r}_{m}}d{r}^{{prime} }{P}_{nc}(r| {r}^{{prime} }){P}_{n}({r}^{{prime} }) \= K(1-pi {r}_{n}^{2}{eta }_{T}r)left{intnolimits_{0}^{{r}_{m}-r}d{r}^{{prime} }{r}^{2}{{r}^{{prime} }}^{2}+intnolimits_{{r}_{m}-r}^{{r}_{m}}d{r}^{{prime} }frac{r{r}^{{prime} }[{r}_{m}^{2}-{(r-{r}^{{prime} })}^{2}]}{4}right} \= K{r}^{2}(1-pi {r}_{n}^{2}{eta }_{T}r){(r-2{r}_{m})}^{2}(r+4{r}_{m})$$
(15)
where ({P}_{nc}(r| {r}^{{prime} })=frac{{n}_{nc}}{{N}_{nc}}) is the probability density of connection length r given neuron i at ({r}^{{prime} }), and ({P}_{n}({r}^{{prime} })=frac{{n}_{n}({r}^{{prime} })}{{N}_{n}}) is the probability of neuron i being at ({r}^{{prime} }). *Nnc is the total connections within the cluster, and K is a normalization factor ensuring (intnolimits_{0}^{2{r}_{m}}{P}_{nc}(r)dr=1). For sufficiently small ηT*, ({P}_{nc}(r) , approx , K{r}^{2}{(r-2{r}_{m})}^{2}(r+4{r}_{m})), independent of density, as confirmed in Fig. 2e at low densities.
Mapping neural connections into the weighted adjacency matrix
After generating neural connections using ray tracing algorithms in our 3D biological neural network learning model, these connections are mapped into an N × N weighted adjacency matrix W. The total neuron capacity (Nin {{mathbb{N}}}^{+}) dictates the number of reserved neural connections in memory. Neuron capacity always exceeds the neuron count (N > {N}_{n}^{lambda },forall lambda) to accommodate neuron addition/deletion without matrix resizing. Here, λ denotes the λ-th transfer learning evolution. Each matrix element {*wij, {i, j} ∈ 1, …, N} represents the weight of a unidirectional ray-traced connection from the i-th to the j-th neuron. Weights wij* are initialized using the Xavier weight initialization algorithm[43].
Storing the full weighted adjacency matrix, including zero-weight elements, is memory-intensive and computationally expensive for matrix multiplication. To address this, W is stored in Compressed Sparse Row (CSR) format, where the value vector ({vec{W}}_{value}) stores only non-zero elements. While CSR matrices are used for forward and backward passes (see “RayBNN Forward Pass” and “Backpropagation” subsections), we use COOrdinate (COO) format matrices for adding and deleting weights/connections. Further details on sparse matrix formats are available in Supplementary Materials S.3.A[25] and S.3.B[25].
Certain neural connections can hinder network performance by overriding values and states. For example, input neuron connections to other input neurons disrupt data flow by overwriting current inputs with previous time step inputs. Setting W(0: *NI − 1, : ) = 0 severs these connections, resolving the issue. Similarly, output neuron connections to other output neurons cause incorrect outputs by overriding current output values. Setting W(: , N − NO − 1: N* − 1) = 0 corrects this.
Self-loops occur when a neuron connects to itself[44]. For memory-less networks, self-loops can degrade performance due to positive feedback cycles leading to infinity. Removing self-loops is achieved by setting the diagonals of the weighted adjacency matrix to zero: diag(W) = 0.
Universal activation function
Choosing the optimal activation function for a specific application in machine learning is challenging due to the variety of available functions. To overcome this, we employ the Universal Activation Function (UAF)[45] in our 3D ray traced biological neural network learning model. UAF dynamically evolves to find the best activation function for each neuron. An example UAF is in Supplementary Information, Section S.4[25]. We apply a unique UAF to each neuron’s output by extending the single-input single-output UAF to a multiple-input multiple-output version. Each neuron has five unique parameters controlling its specific UAF.
The gradient descent algorithm can adjust these parameters, allowing the UAF to evolve into functions like LeakyReLU for some neurons and Tanh for others. The single-input, single-output UAF fUAF(x) is:
$${f}_{{{{{{mathrm{UAF}}}}}}}(x)=ln (1+{e}^{A(x+B)-| C| {x}^{2}})-ln (1+{e}^{D(x-B)})+E$$
(16)
It takes an input (forall xin {mathbb{R}}) and produces output based on trainable parameters (forall A,B,C,D,Ein {mathbb{R}}).
We extend UAF to multiple input/multiple output cases:
$$vec{X}=left[begin{array}{c}{x}_{0}\ {x}_{1}\ {x}_{2}\ vdots \ {x}_{N-1}end{array}right],hat{Y}=left[begin{array}{c}{y}_{0}\ {y}_{1}\ {y}_{2}\ vdots \ {y}_{N-1}end{array}right]$$
(17)
$${{{{{{{{bf{C}}}}}}}}}_{{{{{{{{bf{eff}}}}}}}}}=left[begin{array}{ccccc}{A}_{0}&{B}_{0}&{C}_{0}&{D}_{0}&{E}_{0}\ {A}_{1}&{B}_{1}&{C}_{1}&{D}_{1}&{E}_{1}\ {A}_{2}&{B}_{2}&{C}_{2}&{D}_{2}&{E}_{2}\ vdots &vdots &vdots &vdots &vdots \ {A}_{N-1}&{B}_{N-1}&{C}_{N-1}&{D}_{N-1}&{E}_{N-1}end{array}right]$$
(18)
$${y}_{i}={f}_{{{{{{mathrm{UAF}}}}}}}({x}_{i},{A}_{i},{B}_{i},{C}_{i},{D}_{i},{E}_{i})$$
(19)
$$hat{Y}={vec{f}}_{{{{{{mathrm{UAF}}}}}}}(vec{X},{{{{{{{{bf{C}}}}}}}}}_{{{{{{{{bf{eff}}}}}}}}})$$
(20)
where N is the input vector length (vec{X}in {{mathbb{R}}}^{Ntimes 1}) and output vector (hat{Y}in {{mathbb{R}}}^{Ntimes 1}). ({{{{{{{{bf{C}}}}}}}}}_{{{{{{{{bf{eff}}}}}}}}}in {{mathbb{R}}}^{Ntimes 5}) is a coefficient matrix (forall {A}_{i},{B}_{i},{C}_{i},{D}_{i},{E}_{i}in {mathbb{R}}) shaping individual activation functions. ({vec{f}}_{{{{{{mathrm{UAF}}}}}}}) is applied element-wise to input vector (vec{X}) with input variables (forall {x}_{i}in {mathbb{R}}) to produce output vector (hat{Y}) with output values (forall {y}_{i}in {mathbb{R}}).
RayBNN forward pass
Once the weighted adjacency matrix is configured in our 3D ray traced biological neural network learning model, we can proceed with the forward pass to obtain the neural network’s output states at each time step t. The neural network maintains external and internal states, recording individual neuron output values. The input state vector contains data for input neurons, while the output state vector holds information from output neurons. The internal state vector tracks every active neuron within the network. At each time step t, the forward pass algorithm places the input state vector into input neurons, updates the internal state vector using the previous internal state and the input state, and extracts the output state vector from output neurons.
Mathematically, the input state vector ({vec{X}}^{t}in {{mathbb{R}}}^{{N}_{I}times 1}) and output state vector ({hat{Y}}^{t}in {{mathbb{R}}}^{{N}_{O}times 1}) are defined as:
$${vec{X}}^{t}=left[begin{array}{c}{x}_{0}^{t}\ {x}_{1}^{t}\ {x}_{2}^{t}\ vdots \ {x}_{{N}_{I}-1}^{t}end{array}right],{hat{Y}}^{t}=left[begin{array}{c}{y}_{0}^{t}\ {y}_{1}^{t}\ {y}_{2}^{t}\ vdots \ {y}_{{N}_{O}-1}^{t}end{array}right]$$
(21)
with *NI input and NO* output elements. Input ({vec{X}}^{t}) and output ({vec{Y}}^{t}) are synchronized for training. The neuron bias vector (vec{H}in {{mathbb{R}}}^{Ntimes 1}) and internal state vector ({vec{S}}^{t}in {{mathbb{R}}}^{Ntimes 1}) are initialized as:
$$vec{H}=left[begin{array}{c}{h}_{0}\ {h}_{1}\ {h}_{2}\ vdots \ {h}_{N-1}end{array}right],{vec{S}}^{t}=left[begin{array}{c}{s}_{0}^{t}\ {s}_{1}^{t}\ {s}_{2}^{t}\ vdots \ {s}_{N-1}^{t}end{array}right]$$
(22)
with neuron size N. The bias vector (vec{H}) is typically initialized with random normal numbers and trained via gradient descent. The state vector at t = 0 is initialized to zero: ({vec{S}}^{0}=vec{0}) for a blank initial neuron state.
At each time step t, a temporary state vector ({vec{Q}}^{t}in {{mathbb{R}}}^{Ntimes 1}) is created:
$${vec{Q}}^{t}leftarrow {vec{S}}^{t}$$
(23)
using the current state vector ({vec{S}}^{t}). The input vector ({vec{X}}^{t}) is placed into elements 0 to *N*I − 1 of ({vec{Q}}^{t}):
$${vec{Q}}^{t}(0:{N}_{I}-1)leftarrow {vec{X}}^{t}$$
(24)
Updating input neuron values with the current input vector. To propagate input information to hidden neurons, we update the state of neurons directly connected to the current neuron set, computing the next state vector ({vec{S}}^{t+1}):
$${vec{S}}^{t+1}leftarrow {vec{f}}_{{{{{{mathrm{UAF}}}}}}}({{{{{{{bf{W}}}}}}}}{vec{Q}}^{t}+vec{H},{{{{{{{{bf{C}}}}}}}}}_{{{{{{{{mathbf{{{eff}}}}}}}}}}})$$
(25)
where the weighted adjacency matrix W multiplies ({vec{Q}}^{t}), the bias vector (vec{H}) is added, and the result passes through the activation function ({vec{f}}_{{{{{{mathrm{UAF}}}}}}}).
To ensure input information reaches output neurons, this process is repeated for U time steps, yielding a state vector sequence ({{vec{S}}^{0},{vec{S}}^{1},{vec{S}}^{2},ldots,{vec{S}}^{U-1}}). U = *IT + k, where IT is the input vector time series length, and k is the programmed propagation delay, typically greater than or equal to the mean traversal depth from input to output neurons. Higher k values allow for more complex computations at the cost of time and memory. Output vectors are then extracted from output neurons. For example, output vector ({hat{Y}}^{t}) at time t is constructed from elements N − N*O to N − 1 of state vector ({vec{S}}^{t+k}) at time t + k:
$${hat{Y}}^{t}leftarrow {vec{S}}^{t+k}(N-{N}_{O}:N-1)$$
(26)
Each output vector ({hat{Y}}^{t}) corresponds to an input vector ({hat{X}}^{t}).
Consider a simple example with initial state vector ({vec{S}}^{0}) of all zeros:
$${vec{S}}^{0}=left[begin{array}{c}0.0\ 0.0\ 0.0\ 0.0end{array}right]$$
(27)
Updating ({vec{Q}}^{0}leftarrow {vec{S}}^{0}) and input vector ({vec{Q}}^{t}(0:1)leftarrow {vec{X}}^{0}):
$${vec{X}}^{0}=left[begin{array}{c}-2.1\ 0.3end{array}right],{vec{Q}}^{0}=left[begin{array}{c}-2.1\ 0.3\ 0.0\ 0.0end{array}right]$$
(28)
Next state vector ({vec{S}}^{1}) is computed using ({vec{Q}}^{0}) and W, assuming UAF is an identity function and (vec{H}) is all zeros:
$${{{{{{{bf{W}}}}}}}}=left[begin{array}{cccc}0.2&1.5&-0.1&0.9\ -0.8&0.0&0.6&-1.0\ 1.0&-0.7&3.2&1.2\ -2.0&-0.5&0.7&0.1end{array}right]$$
(29)
$${vec{S}}^{1}=left[begin{array}{cccc}0.2&1.5&-0.1&0.9\ -0.8&0.0&0.6&-1.0\ 1.0&-0.7&3.2&1.2\ -2.0&-0.5&0.7&0.1end{array}right]left[begin{array}{c}-2.1\ 0.3\ 0.0\ 0.0end{array}right]$$
(30)
Output vector ({vec{Y}}^{0}) is then extracted from ({vec{S}}^{1}):
$${vec{S}}^{1}=left[begin{array}{c}0.03\ 1.68\ -2.31\ 4.05end{array}right],{vec{Y}}^{0}=left[begin{array}{c}-2.31\ 4.05end{array}right]$$
(31)
Backpropagation
We use gradient descent algorithms to optimize parameters in our 3D ray traced biological neural network learning model, requiring gradients of weights and biases. A modified backpropagation algorithm, tailored for CSR matrices, is used to compute these gradients. First, the overall loss function J is calculated:
$$J=frac{1}{{I}_{T}}sumlimits_{t=0}^{{I}_{T}}L({hat{Y}}^{t},{vec{Y}}^{t})$$
(32)
using loss function L, network prediction (hat{Y}), and actual output (vec{Y}). The CSR-weighted adjacency matrix W is flattened into a 1D weight vector (vec{W}) (row-major order) for selective weight updates. We find the gradient of the loss function with respect to weights (frac{partial J}{partial vec{W}}) by evaluating the partial derivative of the loss function (frac{partial L}{partial {hat{Y}}^{t}}) at (({hat{Y}}^{t},{vec{Y}}^{t})):
$$frac{partial J}{partial vec{W}}=frac{1}{{I}_{T}}sumlimits_{t=0}^{{I}_{T}}left[left.frac{partial L}{partial {hat{Y}}^{t}}right|_{({hat{Y}}^{t},{vec{Y}}^{t})}odot frac{partial {hat{Y}}^{t}}{partial vec{W}}right]$$
(33)
and evaluating the partial derivative of the activation function ({vec{f}}_{UAF}) with respect to input vector (vec{X}). ⊙ denotes element-wise multiplication. Partial derivatives (frac{partial L}{partial {hat{Y}}^{t}}) , (frac{partial vec{Q}}{partial vec{W}}), and (frac{partial {vec{f}}_{UAF}}{partial vec{X}}) are reshaped to match (vec{W}) dimensions.
$$frac{partial {hat{Y}}^{t}}{partial vec{W}}=left.frac{partial {vec{f}}_{UAF}}{partial vec{X}}right|_{{bf{W}}{vec{Q}}^{t+k-1}+vec{H}}odot frac{partial }{partial vec{W}}left[{bf{W}}{vec{Q}}^{t+k-1}right]$$
(34)
The partial derivative of the state vector (frac{partial vec{Q}}{partial vec{W}}) is recursively computed until ({frac{partial vec{Q}}{partial vec{W}}}^{0}) is reached:
$$frac{partial }{partial vec{W}}left[{{{{{{{bf{W}}}}}}}}{vec{Q}}^{t+k-1}right]={vec{Q}}^{t+k-1}+{{{{{{{bf{W}}}}}}}}{frac{partial vec{Q}}{partial vec{W}}}^{t+k-1}$$
(35)
$${frac{partial vec{Q}}{partial vec{W}}}^{t+k-1}=frac{partial {vec{f}}_{UAF}}{partial vec{X}}{Bigg| }_{{{{{{{{bf{W}}}}}}}}{vec{Q}}^{t+k-2}+vec{H}}odot frac{partial }{partial vec{W}}left[{{{{{{{bf{W}}}}}}}}{vec{Q}}^{t+k-2}right]$$
(36)
For example, with an MSE loss function and equations from the previous subsection:
$$J={({hat{Y}}^{0}-{vec{Y}}^{0})}^{{mathsf{T}}}({hat{Y}}^{0}-{vec{Y}}^{0})$$
(37)
$$frac{partial J}{partial vec{W}}=2({hat{Y}}^{0}-{vec{Y}}^{0})odot frac{partial {hat{Y}}^{0}}{partial vec{W}}$$
(38)
$$vec{f}_{UAF}=vec{X},frac{partial {vec{f}}_{UAF}}{partial vec{X}}{| }_{{{{{{{{bf{W}}}}}}}}{vec{Q}}^{0}+vec{H}}=vec{1}$$
(39)
$$frac{partial {hat{Y}}^{0}}{partial vec{W}}=vec{1}odot left[{vec{Q}}^{0}+{{{{{{{bf{W}}}}}}}}{frac{partial vec{Q}}{partial vec{W}}}^{0}right]$$
(40)
Deleting neural connections
When transferring between datasets in our 3D ray traced biological neural network learning model, reduced dataset size and inputs can lead to overfitting and performance degradation. Reducing trainable parameters by deleting neural connections can mitigate this. Smaller weights have minimal output impact, making them candidates for deletion. We delete the 5% smallest weights by finding their indexes (vec{i},vec{j}) and setting ({{{{{{{bf{W}}}}}}}}(vec{i},vec{j})) to zero. COO matrix element deletion is described in Supplementary Material Subsection S.3.A[25]. Excessive deletion can cause the network to get stuck in local minima. Repeatedly adding and deleting connections each epoch can help escape local minima and descend to the global minimum.
Algorithm 2
Deleting neural connections in RayBNN
R ← randomUniform(0.0,1.0);
R ← elemwiseMulti(R,W);
(vec{i},vec{j}) ← argmin(∣R∣);
({{{{{{{bf{W}}}}}}}}(vec{i},vec{j})) ← 0.0;
To address this, we probabilistically delete weights, allowing larger weights to be removed at lower probability than smaller weights. Algorithm 2 implements this: a random matrix R (same dimensions as W) is initialized with uniform random numbers [0.0, 1.0]. R is element-wise multiplied with W, and the result is stored in R. Elements in W are set to zero based on the indexes of the 5% smallest values in R.
Deleting redundant neurons
Deleting neural connections in our 3D ray traced biological neural network learning model can result in redundant neurons – neurons with no outputs but still possessing input weights. These neurons can be safely removed without affecting network output or performance. Redundant neurons are identified by checking output degrees Dout(*Pi) of neurons Pi. Neurons with Dout(Pi) = 0 are checked for input connections. If input degrees are greater than zero, input connections/weights are removed by setting elements in row i to zero: wi,0 = wi,1 = wi,2 = … = w*i,N−1 = 0. Deleted neurons also have their cell positions ({vec{P}}_{i}) removed from the neuron position master list.
Redundant neuron deletion differs from dropout. Dropout randomly deletes neurons and connections, altering network outputs. Redundant neuron deletion, however, does not change outputs as these neurons do not contribute information to other neurons.
Details of other models for comparison
For comparison in our study of the 3D ray traced biological neural network learning model, we used several established models. The CNN model comprised one CNN layer (4 channels, 5 × 1 filters) and two dense layers (neurons twice input size). Hidden layers used LeakyReLU activation, the final layer used identity activation. The MLP model had three dense layers (neuron count per layer equal to input size). The LSTM model included two LSTM layers and a final dense layer, with LSTM layers having neuron counts equal to input size, tanh activation, and the dense layer using identity activation. The BiLSTM model mirrored the LSTM structure, replacing LSTM layers with BiLSTM layers and doubling dense layer size to match BiLSTM layers. The GCN2 model used four graph convolutional layers and two linear graph layers, with graph convolutional layers performing convolutions on input nodes/edges for output node prediction, and linear graph layers formatting the result. The GCN2LSTM model was similar to GCN2, replacing graph convolutional layers with graph LSTM layers. Tenfold testing ensured reproducibility, with networks randomly initialized and trained in each fold, and performance evaluated independently to obtain mean absolute error (MAE) and training time standard deviation.
Software framework
We developed a custom software framework for simulating physical neurons and training biological neural networks, utilizing the Rust programming language for its compile-time code verification, preventing common programming errors. Rust’s unit testing ensures function and module correctness. Arrayfire for Rust[46], a parallel computing library for CUDA, OpenCL, and OpenMP, accelerates code execution, enabling operation on Nvidia, AMD, and Intel GPUs/CPUs, and Xilinx FPGAs.
Supplementary information
Detailed implementation specifics of RayBNN are provided in a supplementary material article[25]. An animation demonstrating RayBNN evolution during training on the Alcala dataset is also included.
Reporting summary
Further details on research design are available in the Nature Portfolio Reporting Summary linked to this article.
