A/b Testing Machine Learning Models is a powerful technique for data-driven decision-making. At learns.edu.vn, we help you understand how to effectively compare different model versions in a real-world setting to optimize performance. Discover how to design, implement, and analyze A/B tests to ensure your machine learning models deliver the best possible results, leveraging statistically significant insights to drive your business forward. Learn about experimentation pipelines, key metrics, and statistical significance.
1. Understanding the Fundamentals of A/B Testing
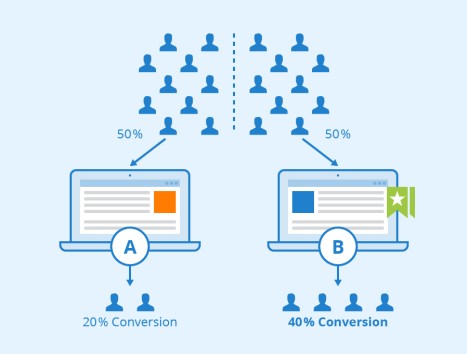
A/B testing, also known as split testing, is a methodology for comparing two versions of something to determine which performs better. This method is widely used in various fields, including marketing, web development, and, increasingly, machine learning. The core idea is to randomly divide subjects into two groups: a control group (A) and a treatment group (B).
1.1. The Basic Principles of A/B Testing
In the context of A/B testing machine learning models, the control group (A) typically uses the existing model (champion), while the treatment group (B) uses the new model (challenger). The goal is to measure and compare the performance of these models based on a predefined metric. This allows for a statistically sound decision on whether to deploy the new model.
The A/B testing process generally includes the following steps:
- Define the Objective: Clearly identify what you want to improve or measure.
- Create Variations: Develop two versions—the control (A) and the challenger (B).
- Random Assignment: Randomly assign users or data points to either group.
- Measure and Collect Data: Track the performance of each version based on the defined metric.
- Analyze Results: Use statistical methods to determine if the observed differences are significant.
- Implement the Winner: Deploy the version that performs better.
1.2. Historical Context and Evolution of A/B Testing
The concept of controlled experiments dates back centuries. One of the earliest examples is from the Old Testament, where a nutrition test was conducted to compare the health of those eating vegetables versus royal rations (Daniel 1:12-13). In 1747, Dr. James Lind conducted a clinical trial to test the efficacy of citrus fruit for curing scurvy.
In the modern era, A/B testing gained popularity with the rise of the internet and data-driven decision-making. Companies like Google and Amazon have used A/B testing extensively to optimize their websites, marketing campaigns, and product features. The application of A/B testing in machine learning is a more recent development, driven by the increasing complexity and importance of ML models in business operations.
1.3. Why A/B Testing is Essential for Machine Learning
A/B testing is crucial for machine learning because it allows data scientists to validate model performance in real-world conditions. While offline testing and validation are important, they often don’t fully capture the complexities of live data and user behavior. A/B testing provides a reliable way to determine whether a new model truly improves performance compared to the existing one.
Here’s why A/B testing is indispensable for machine learning:
- Real-World Validation: A/B testing exposes models to real-world data and user interactions, providing insights that offline testing cannot.
- Data-Driven Decisions: It replaces subjective opinions with objective, measurable data, leading to better decision-making.
- Risk Mitigation: By gradually rolling out new models through A/B testing, organizations can identify and address potential issues before a full deployment.
- Continuous Improvement: A/B testing fosters a culture of continuous improvement, allowing for ongoing optimization and refinement of machine learning models.
2. Designing an Effective Machine Learning A/B Test
Designing an effective A/B test for machine learning models requires careful planning and consideration of several key factors. This includes defining the objective, selecting the appropriate metrics, determining the sample size, and understanding the statistical considerations.
2.1. Defining the Objective and Key Performance Indicators (KPIs)
The first step in designing an A/B test is to clearly define the objective. What specific improvement are you trying to achieve with the new model? This objective should be measurable and aligned with business goals.
Examples of objectives include:
- Increased Conversion Rate: Improving the percentage of users who complete a desired action (e.g., making a purchase, signing up for a newsletter).
- Improved Click-Through Rate (CTR): Increasing the percentage of users who click on a specific link or advertisement.
- Reduced Churn Rate: Decreasing the percentage of customers who stop using a product or service.
- Enhanced Customer Satisfaction: Improving customer satisfaction scores based on feedback or surveys.
- Improved Prediction Accuracy: Validating the increased accuracy of machine learning model.
Once the objective is defined, select the Key Performance Indicators (KPIs) that will be used to measure progress toward that objective. KPIs should be specific, measurable, achievable, relevant, and time-bound (SMART).
2.2. Selecting the Right Metrics for Evaluation
Choosing the right metrics is crucial for accurately evaluating the performance of machine learning models in an A/B test. The metrics should directly reflect the objective and be sensitive enough to detect meaningful differences between the control and treatment groups.
Common metrics for evaluating machine learning models include:
| Metric | Description | Example Use Case |
|---|---|---|
| Conversion Rate | The percentage of users who complete a desired action (e.g., purchase, sign-up). | E-commerce website testing a new product recommendation algorithm to see if it increases the percentage of users who make a purchase. |
| Click-Through Rate (CTR) | The percentage of users who click on a specific link or advertisement. | Online advertising platform testing different ad creatives to see which one generates a higher percentage of clicks. |
| Churn Rate | The percentage of customers who stop using a product or service. | Subscription-based service testing a new onboarding process to see if it reduces the percentage of customers who cancel their subscriptions within the first month. |
| Customer Satisfaction (CSAT) | A measure of how satisfied customers are with a product or service, typically collected through surveys or feedback forms. | Customer support system testing a new chatbot to see if it improves customer satisfaction scores. |
| Accuracy | The percentage of correct predictions made by the model. | Medical diagnosis system testing a new model to see if it improves the accuracy of disease detection. |
| Precision | The proportion of positive identifications that were actually correct. | Spam detection system testing a new model to see if it reduces the number of legitimate emails that are incorrectly classified as spam. |
| Recall | The proportion of actual positives that were identified correctly. | Fraud detection system testing a new model to see if it increases the number of fraudulent transactions that are correctly identified. |
| F1-Score | The harmonic mean of precision and recall, providing a balanced measure of a model’s accuracy. | Information retrieval system testing a new search algorithm to see if it improves the overall relevance of search results. |
| AUC-ROC | Area Under the Receiver Operating Characteristic curve, which measures the model’s ability to distinguish between positive and negative classes across various threshold settings. | Credit risk assessment system testing a new model to see if it improves the ability to accurately assess the risk of loan defaults. |
| Latency | The time it takes for the model to generate a prediction. | Real-time recommendation engine testing a new model to see if it reduces the time it takes to generate personalized recommendations. |
| Throughput | The number of predictions the model can generate per unit of time. | High-volume transaction processing system testing a new model to see if it increases the number of transactions that can be processed per second. |
| Resource Utilization | The amount of computational resources (e.g., CPU, memory) required to run the model. | Cloud-based machine learning service testing a new model to see if it reduces the cost of running the model by optimizing resource utilization. |
| Cost per Prediction | The cost associated with generating each prediction, taking into account infrastructure costs, model complexity, and other factors. | Enterprise-level AI platform testing a new model to see if it reduces the operational expenses of running machine learning models at scale. |
| Return on Investment (ROI) | The overall financial return generated by the model, taking into account the costs of development, deployment, and maintenance. | Business analytics team testing a new model to see if it improves the overall profitability of a marketing campaign. |
2.3. Determining Sample Size and Statistical Significance
Determining the appropriate sample size is essential to ensure that the results of the A/B test are statistically significant. A sample size that is too small may lead to inconclusive results, while a sample size that is too large may be wasteful of resources.
To determine the sample size, consider the following factors:
- Baseline Conversion Rate (y0): The current conversion rate of the existing model.
- Minimum Detectable Effect (δ): The smallest improvement that you want to be able to detect with the A/B test.
- Statistical Power (β): The probability of detecting a statistically significant effect when one truly exists (typically set to 0.8).
- Significance Level (α): The probability of incorrectly concluding that there is a statistically significant effect when one does not exist (typically set to 0.05).
Use a power calculator or sample size calculator to determine the required sample size based on these parameters. Several online calculators are available, such as the one from Statsig.
Once the A/B test has been run, use statistical tests (e.g., t-test, chi-squared test) to determine whether the observed differences between the control and treatment groups are statistically significant. If the p-value is less than the significance level (α), then the results are considered statistically significant, and you can conclude that the new model performs better than the existing one.
2.4. Randomization and Avoiding Bias in A/B Tests
Randomization is a fundamental principle of A/B testing. It ensures that subjects are randomly assigned to either the control or treatment group, minimizing the risk of bias. Bias can occur if there are systematic differences between the groups that could influence the results.
To ensure proper randomization:
- Use a random number generator to assign subjects to groups.
- Check for imbalances in key demographic or behavioral variables between the groups.
- Be aware of potential sources of bias, such as selection bias, sampling bias, and confirmation bias.
- Run A/A tests to verify that the randomization process is working correctly.
2.5. Setting Up A/A Tests
An A/A test is a variation of an A/B test where both groups are exposed to the same version of a system or model. The primary purpose of an A/A test is to validate the testing infrastructure and ensure that the randomization process is working correctly. By comparing two identical groups, you can identify any unintended biases or errors in the setup, data collection, or analysis.
Here’s how to conduct an A/A test and its importance:
- Validation of Infrastructure: A/A tests help ensure that the A/B testing tools and systems are functioning as expected. This includes verifying that the data collection, processing, and analysis are accurate and reliable.
- Identification of Biases: By splitting the traffic into two identical groups, you can identify any systematic biases in the randomization process or data collection methods.
- Establishment of Baseline: A/A tests establish a baseline performance level against which you can compare the results of subsequent A/B tests.
2.6. Practical Considerations for Setting Up A/B Tests
In addition to the theoretical considerations, there are several practical factors to keep in mind when setting up A/B tests:
- Consistency: Ensure that subjects consistently receive the same treatment throughout the A/B test.
- Scalability: Design the A/B test to handle a large volume of data and traffic.
- Monitoring: Continuously monitor the A/B test to detect any issues or anomalies.
- Segmentation: Consider segmenting the data to analyze the impact of the new model on different user groups.
3. Implementing A/B Testing in Production
Implementing A/B testing in a production environment involves several steps, including setting up the infrastructure, routing traffic, collecting data, and monitoring performance. This section provides a detailed guide to these steps.
3.1. Setting Up the Infrastructure for A/B Testing
The infrastructure for A/B testing typically includes the following components:
- Load Balancer: Distributes traffic between the control and treatment groups.
- Experimentation Framework: Manages the A/B test, including assigning subjects to groups, collecting data, and analyzing results.
- Data Storage: Stores the data collected during the A/B test.
- Monitoring System: Monitors the performance of the models and the A/B test infrastructure.
Several tools and platforms can be used to set up the A/B testing infrastructure, including:
- Wallaroo: Provides a specialized ML deployment platform with pipeline configurations for setting up A/B tests.
- Optimizely: A popular A/B testing platform for websites and mobile apps.
- Google Optimize: A free A/B testing tool integrated with Google Analytics.
- VWO: A comprehensive A/B testing and conversion optimization platform.
- AB Tasty: An A/B testing and personalization platform.
3.2. Traffic Routing and Allocation Strategies
Traffic routing is the process of directing users or data points to either the control or treatment group. Several strategies can be used for traffic routing, including:
- Random Split: Randomly assigns subjects to groups based on a predefined ratio (e.g., 50-50, 80-20).
- Key Split: Assigns subjects to groups based on the value of a key or query attribute (e.g., customer ID, geographic location).
- Dynamic Allocation: Dynamically adjusts the allocation of traffic based on the performance of the models (e.g., multi-armed bandit approach).
The choice of traffic routing strategy depends on the specific requirements of the A/B test. Random split is the most common strategy for A/B testing, as it ensures that the groups are unbiased.
3.3. Data Collection and Storage
Collecting and storing the data generated during the A/B test is essential for analyzing the results. The data should include:
- User ID or Session ID: Identifies the subject.
- Group Assignment: Indicates whether the subject was assigned to the control or treatment group.
- Performance Metrics: The values of the KPIs being measured.
- Timestamp: The time when the data was collected.
The data can be stored in a variety of formats, including:
- Relational Database: A structured database for storing and querying data.
- NoSQL Database: A non-relational database for storing large volumes of unstructured or semi-structured data.
- Data Warehouse: A centralized repository for storing and analyzing large volumes of data from multiple sources.
- Cloud Storage: A scalable and cost-effective solution for storing data in the cloud.
3.4. Monitoring and Logging A/B Test Performance
Monitoring the performance of the A/B test is crucial for detecting any issues or anomalies. The monitoring system should track the following metrics:
- Traffic Distribution: The percentage of traffic being routed to each group.
- Performance Metrics: The values of the KPIs being measured.
- Error Rates: The number of errors or failures occurring in each group.
- Latency: The time it takes for the models to generate predictions.
- Resource Utilization: The amount of computational resources being used by the models.
The monitoring system should also generate alerts when any of these metrics deviate from expected values. Logging is essential for auditing and troubleshooting purposes. The logs should include detailed information about the A/B test, including:
- Configuration Settings: The parameters of the A/B test, such as the sample size, significance level, and traffic allocation strategy.
- Events: Key events that occur during the A/B test, such as the start and end times, changes to the configuration, and alerts.
- Errors: Any errors or failures that occur during the A/B test.
3.5. Addressing Common Challenges in Production A/B Testing
Implementing A/B testing in a production environment can be challenging. Some common challenges include:
- Scalability: Ensuring that the A/B testing infrastructure can handle a large volume of traffic and data.
- Complexity: Managing the complexity of A/B testing multiple models or features simultaneously.
- Data Quality: Ensuring the accuracy and reliability of the data collected during the A/B test.
- Statistical Rigor: Applying appropriate statistical methods to analyze the results of the A/B test.
- Organizational Alignment: Aligning the A/B testing process with business goals and priorities.
To address these challenges, it is essential to:
- Invest in a robust and scalable A/B testing infrastructure.
- Use an experimentation framework to manage the complexity of A/B testing.
- Implement data quality checks to ensure the accuracy and reliability of the data.
- Consult with statisticians to ensure that appropriate statistical methods are used.
- Establish clear goals and priorities for A/B testing and align them with business objectives.
4. Analyzing and Interpreting A/B Test Results
Analyzing and interpreting the results of an A/B test is critical for making informed decisions about whether to deploy a new machine learning model. This section covers the key steps involved in this process.
4.1. Statistical Methods for Analyzing A/B Test Data
Several statistical methods can be used to analyze A/B test data, depending on the type of metric being measured. Some common methods include:
- T-Test: Used to compare the means of two groups when the metric is continuous (e.g., conversion rate, revenue).
- Chi-Squared Test: Used to compare the proportions of two groups when the metric is categorical (e.g., click-through rate, churn rate).
- ANOVA: Used to compare the means of multiple groups when the metric is continuous.
- Regression Analysis: Used to model the relationship between the metric and other variables.
Before applying these methods, it is important to check the assumptions of the statistical tests. For example, the t-test assumes that the data is normally distributed and has equal variances. If these assumptions are violated, it may be necessary to use a non-parametric test, such as the Mann-Whitney U test.
4.2. Calculating Confidence Intervals and P-Values
Confidence intervals and p-values are used to assess the statistical significance of the results.
- Confidence Interval: A range of values that is likely to contain the true population parameter with a certain level of confidence (e.g., 95%). A narrower confidence interval indicates a more precise estimate of the parameter.
- P-Value: The probability of observing the data (or more extreme data) if there is no true difference between the groups. A smaller p-value indicates stronger evidence against the null hypothesis (i.e., there is a true difference between the groups).
Typically, a p-value less than 0.05 is considered statistically significant, meaning that there is a less than 5% chance of observing the data if there is no true difference between the groups.
4.3. Interpreting Results and Making Decisions
Interpreting the results of an A/B test involves considering both the statistical significance and the practical significance of the findings. Statistical significance indicates whether the observed differences are likely due to chance, while practical significance indicates whether the differences are meaningful in a business context.
For example, a statistically significant improvement in conversion rate may not be practically significant if the improvement is very small (e.g., 0.1%). In this case, the cost of implementing the new model may outweigh the benefits.
When making decisions based on A/B test results, consider the following factors:
- Statistical Significance: Is the p-value less than the significance level (α)?
- Practical Significance: Is the improvement large enough to be meaningful in a business context?
- Cost: What is the cost of implementing the new model?
- Risk: What are the potential risks of deploying the new model?
Based on these factors, you can decide whether to deploy the new model, continue testing, or abandon the project.
4.4. Common Pitfalls in A/B Test Analysis
Several common pitfalls can lead to incorrect conclusions in A/B test analysis. Some of these pitfalls include:
- Peeking: Looking at the results before the A/B test has reached the required sample size.
- Multiple Comparisons: Conducting multiple statistical tests without adjusting the significance level.
- Ignoring Regression to the Mean: Failing to account for the fact that extreme values tend to regress toward the mean over time.
- Simpson’s Paradox: Observing a trend in different groups of data but finding the opposite trend when the groups are combined.
- Confirmation Bias: Seeking out evidence that confirms pre-existing beliefs.
To avoid these pitfalls, it is important to:
- Wait until the A/B test has reached the required sample size before looking at the results.
- Adjust the significance level when conducting multiple statistical tests.
- Account for regression to the mean when interpreting the results.
- Be aware of Simpson’s paradox and look for potential confounding variables.
- Be objective and avoid confirmation bias.
4.5. Documenting and Communicating A/B Test Findings
Documenting and communicating the findings of A/B tests is essential for sharing knowledge and improving the decision-making process. The documentation should include:
- Objective: The goal of the A/B test.
- Hypothesis: The prediction being tested.
- Methodology: The design of the A/B test, including the sample size, traffic allocation strategy, and metrics being measured.
- Results: The statistical analysis of the data, including confidence intervals and p-values.
- Interpretation: The conclusions drawn from the A/B test.
- Recommendations: The actions that should be taken based on the results.
The findings should be communicated to stakeholders in a clear and concise manner, using visualizations and summaries to highlight the key points.
5. Advanced Techniques and Extensions to A/B Testing
Beyond the basic A/B testing methodology, several advanced techniques can be used to optimize and refine the testing process.
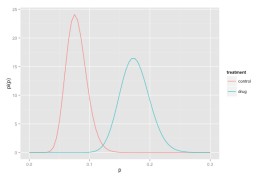
5.1. Bayesian A/B Testing
Bayesian A/B testing is an alternative approach to traditional (frequentist) A/B testing. Instead of relying on p-values and confidence intervals, Bayesian A/B testing uses Bayesian inference to estimate the probability that one model is better than another.
The general steps for a Bayesian analysis are:
- Specify Prior Beliefs: Define prior beliefs about the possible values of the metric for each group.
- Define Statistical Model: Use a Bayesian analysis tool and flat, uninformative, or equal priors for each group.
- Collect Data: Collect data and update beliefs about possible values for the metrics as the experiment progresses.
- Refine Estimates: Continue the experiment as long as it seems valuable to refine the estimates of the metrics.
Bayesian A/B testing offers several advantages over traditional A/B testing:
- Intuitive Interpretation: Bayesian results are often easier to interpret than frequentist results.
- Flexibility: Bayesian methods can handle complex experimental designs.
- Adaptive Learning: Bayesian methods can incorporate prior knowledge into the analysis.
5.2. Multi-Armed Bandit Testing
Multi-armed bandit (MAB) testing is an adaptive approach to A/B testing that dynamically adjusts the allocation of traffic to different models based on their performance. The goal of MAB testing is to maximize the overall reward by allocating more traffic to the better-performing models.
MAB testing balances the trade-off between exploration (collecting information about different models) and exploitation (using the best-performing model). The algorithm continuously learns from the data and adjusts the traffic allocation accordingly.
MAB testing is particularly useful when:
- There is a large number of models to test.
- The goal is to maximize the overall reward during the testing process.
- The environment is dynamic and the performance of the models may change over time.
5.3. Sequential Testing
Sequential testing is a method of A/B testing in which the data is analyzed continuously as it is collected, and the test is stopped as soon as a statistically significant result is obtained. This can save time and resources compared to traditional A/B testing, in which the data is analyzed only after a fixed sample size has been reached.
Sequential testing requires careful attention to the statistical properties of the test to avoid inflating the false positive rate. Several methods have been developed to address this issue, such as the sequential probability ratio test (SPRT).
5.4. Factorial Testing
Factorial testing is a method of A/B testing in which multiple factors are varied simultaneously to assess their individual and combined effects on the metric being measured. This can be more efficient than testing each factor separately.
For example, if you want to test the effects of two different website designs and two different pricing strategies, you can use factorial testing to test all four combinations simultaneously. This allows you to determine not only the individual effects of each factor but also whether there is an interaction effect between the factors.
5.5. Personalization and Contextual A/B Testing
Personalization and contextual A/B testing involve tailoring the A/B test to specific users or contexts. This can improve the relevance and effectiveness of the A/B test.
For example, you can personalize the A/B test based on user demographics, behavior, or preferences. You can also contextualize the A/B test based on the time of day, geographic location, or device type.
Personalization and contextual A/B testing can lead to more accurate and actionable results, but they also require more sophisticated data collection and analysis techniques.
6. Ethical Considerations in A/B Testing
A/B testing, while powerful, raises ethical considerations that organizations must address. Transparency, user consent, and fairness are critical principles to uphold.
6.1. Transparency and User Consent
Users should be informed when they are part of an A/B test. Transparency builds trust and allows users to make informed decisions about their participation.
Best practices for transparency and user consent include:
- Clearly Disclose Testing: Inform users that they may be part of an A/B test in the terms of service or privacy policy.
- Provide Opt-Out Options: Allow users to opt-out of participating in A/B tests.
- Explain the Purpose: Clearly state the purpose of the A/B test and how the data will be used.
- Use Clear Language: Avoid technical jargon and use language that is easy for users to understand.
6.2. Privacy and Data Security
Protecting user privacy and ensuring data security are paramount in A/B testing. Organizations must implement appropriate measures to safeguard user data.
Key considerations for privacy and data security include:
- Anonymization: Anonymize user data to prevent identification.
- Data Encryption: Encrypt data both in transit and at rest.
- Access Controls: Implement strict access controls to limit who can access user data.
- Data Retention Policies: Establish clear data retention policies to ensure that data is not stored longer than necessary.
- Compliance: Comply with relevant privacy regulations, such as GDPR and CCPA.
6.3. Fairness and Bias Mitigation
A/B testing should be conducted in a fair and unbiased manner. Bias can creep into the A/B testing process through various sources, such as biased data, biased algorithms, or biased experimental designs.
To mitigate bias:
- Use Representative Data: Ensure that the data used for A/B testing is representative of the target population.
- Check for Bias: Conduct thorough checks for bias in the data and algorithms.
- Design Fair Experiments: Design experiments that are fair to all users, regardless of their demographics or other characteristics.
- Monitor for Unintended Consequences: Monitor the results of A/B tests for unintended consequences, such as discrimination or unfair treatment.
6.4. Potential Risks and Mitigation Strategies
A/B testing can have potential risks, such as:
- Negative User Experiences: A/B testing can lead to negative user experiences if the new model is poorly designed or implemented.
- Decreased Trust: Lack of transparency and user consent can decrease user trust.
- Legal and Regulatory Issues: Failure to comply with privacy regulations can lead to legal and regulatory issues.
To mitigate these risks:
- Thorough Testing: Conduct thorough testing of the new model before deploying it in an A/B test.
- Transparency and Consent: Be transparent with users and obtain their consent before including them in an A/B test.
- Compliance: Comply with relevant privacy regulations.
- Monitoring: Monitor the results of A/B tests for negative user experiences and other unintended consequences.
6.5. Establishing Ethical Guidelines and Best Practices
Organizations should establish ethical guidelines and best practices for A/B testing. These guidelines should be based on the principles of transparency, user consent, privacy, fairness, and accountability.
The ethical guidelines should be communicated to all employees involved in A/B testing, and training should be provided to ensure that the guidelines are followed. Regular audits should be conducted to ensure compliance with the ethical guidelines.
7. Case Studies and Real-World Examples
Examining case studies and real-world examples can provide valuable insights into how A/B testing is used in practice.
7.1. Successful A/B Testing Campaigns in Various Industries
- E-Commerce: Amazon uses A/B testing to optimize product recommendations, search results, and checkout processes. These tests have resulted in significant increases in revenue and customer satisfaction.
- Social Media: Facebook uses A/B testing to optimize news feed algorithms, ad targeting, and user interface designs. These tests have helped Facebook increase user engagement and ad revenue.
- Search Engines: Google uses A/B testing to optimize search algorithms, user interface designs, and ad placements. These tests have helped Google maintain its dominance in the search engine market.
- Healthcare: Medical diagnosis system testing a new model to see if it improves the accuracy of disease detection.
- Finance: Credit risk assessment system testing a new model to see if it improves the ability to accurately assess the risk of loan defaults.
7.2. Lessons Learned from Failed A/B Tests
Even well-designed A/B tests can fail. Some common reasons for failure include:
- Poorly Defined Objectives: Lack of clear objectives can lead to irrelevant or misleading results.
- Inadequate Sample Size: Insufficient sample sizes can result in statistically insignificant findings.
- Biased Data: Biased data can skew the results and lead to incorrect conclusions.
- Technical Issues: Technical issues, such as bugs or glitches, can invalidate the results.
- Misinterpretation of Results: Misinterpreting the results can lead to incorrect decisions.
Lessons learned from failed A/B tests include:
- Define Objectives Clearly: Ensure that the objectives of the A/B test are clearly defined and aligned with business goals.
- Calculate Sample Size: Calculate the required sample size before starting the A/B test.
- Check Data for Bias: Check the data for bias and take steps to mitigate it.
- Test Thoroughly: Test the A/B test thoroughly before launching it to production.
- Interpret Results Carefully: Interpret the results carefully and avoid drawing premature conclusions.
7.3. Applying A/B Testing in Different Machine Learning Scenarios
A/B testing can be applied in various machine learning scenarios, such as:
- Model Selection: Comparing the performance of different machine learning models to determine which one to deploy.
- Feature Engineering: Testing the impact of different features on model performance.
- Hyperparameter Tuning: Optimizing the hyperparameters of a machine learning model.
- Deployment Strategies: Comparing different deployment strategies, such as online vs. offline deployment.
7.4. Measuring the Impact of A/B Testing on Business Outcomes
Measuring the impact of A/B testing on business outcomes is essential for justifying the investment in A/B testing and demonstrating its value. Metrics that can be used to measure the impact of A/B testing include:
- Revenue: The amount of revenue generated by the business.
- Conversion Rate: The percentage of users who complete a desired action.
- Customer Satisfaction: The level of satisfaction of customers.
- User Engagement: The level of engagement of users with the product or service.
- Cost Savings: The amount of cost savings achieved through A/B testing.
7.5. Future Trends in A/B Testing and Experimentation
Future trends in A/B testing and experimentation include:
- AI-Powered A/B Testing: Using AI to automate the A/B testing process and improve its efficiency.
- Personalized A/B Testing: Tailoring A