Training a machine learning model involves teaching an algorithm to make predictions or decisions based on data. At LEARNS.EDU.VN, we guide you through this process, ensuring you grasp the fundamentals and intricacies of model training. Understanding how to train a machine learning model is crucial for creating intelligent systems that solve complex problems.
1. What is Training a Model in Machine Learning?
Training a machine learning model is the process of teaching an algorithm to make predictions or decisions based on data. It’s like teaching a child to recognize patterns from examples. Just as you’d show a child pictures of animals to distinguish between cats and dogs, machine learning models learn from vast amounts of data to make accurate predictions or classifications.
Here’s a breakdown of the key components of model training:
- Data: The lifeblood of machine learning. It consists of input features (attributes) and their corresponding output labels or targets. The model learns patterns from this training data to make predictions.
- Algorithm: The mathematical or computational procedure that the model uses to learn from the data. It’s the set of rules that guides the learning process.
- Parameters: The internal settings or weights that the model adjusts during training to fit the data. These adjustments aim to minimize the difference between the model’s predictions and the actual outcomes.
- Loss Function: Measures the dissimilarity between the model’s predictions and the actual target values. During training, the model strives to minimize this loss, effectively improving its accuracy.
- Optimization: Techniques employed to adjust the model’s parameters iteratively. Gradient descent is a common optimization method used to find the optimal parameter values.
The significance of training a model is paramount, laying the groundwork for sophisticated machine learning applications.
1.1 Importance of Model Training
Model training is crucial because it enables a model to generalize from seen data to make accurate predictions on new, unseen data. This generalization ability is the ultimate goal of machine learning.
- Generalization: Training enables a model to generalize from the data it has seen to make accurate predictions on new, unseen data. This is the ultimate goal of machine learning – to create models that can make intelligent decisions in real-world scenarios.
- Pattern Recognition: Through training, models learn to recognize complex patterns, relationships, and trends within the data that may be imperceptible to humans. This ability to extract valuable insights is crucial in various domains, from healthcare to finance.
- Automation: Trained models can automate decision-making processes, saving time and resources. They can classify emails as spam or not, recommend products to customers, or identify anomalies in industrial equipment, all without human intervention.
- Continuous Learning: Machine learning models can be retrained with new data to adapt to changing conditions and improve their accuracy over time. This adaptability is invaluable in dynamic environments.
Through this process, models recognize intricate patterns and automate decision-making, adapting to dynamic environments. Dive deeper into the intricacies of data preparation, algorithm selection, and model evaluation with LEARNS.EDU.VN.
2. How to Train a Machine Learning Model: Essential Steps
Mastering the steps to train a machine learning model effectively is your gateway to crafting robust machine learning applications. From gathering and preparing data to evaluating model performance, each step is essential for success.
2.1 Gathering and Preparing Data
The first step in any machine learning project is gathering and preparing the data. This involves:
- Data Collection: Selecting a dataset that is relevant to the problem and contains appropriate target labels (values to predict or categorize) and features (input variables).
- Data Cleaning: Addressing issues like missing values, outliers, and inconsistent formats. The aim is to maintain consistency by imputing missing numbers, eliminating or modifying outliers, and changing data types. According to a study by IBM, data scientists spend approximately 80% of their time on data preparation tasks.
- Data Preprocessing: Preparing the data for the machine learning algorithm. This includes standardizing features (scaling to a common range), encoding categorical variables into numerical representations, and creating additional features that might improve model performance.
2.2 Choosing the Right Algorithm
Selecting the right machine learning algorithm is a crucial choice that depends on the specifics of the problem. Consider elements like the size of your dataset, the complexity of the problem, and the algorithm’s underlying assumptions.
Consider these types of Machine Learning Algorithms for specific tasks
| Algorithm Category | Example Algorithms | Use Cases |
|---|---|---|
| Regression | Linear Regression, Random Forest | Predicting continuous values, such as sales forecasting or stock prices |
| Classification | Logistic Regression, Support Vector Machines | Categorizing data into different classes, such as spam detection or image recognition |
| Clustering | K-Means, Hierarchical Clustering | Grouping similar data points together, such as customer segmentation |
| Dimensionality Reduction | Principal Component Analysis (PCA) | Reducing the number of variables in a dataset while retaining important information |

2.3 Splitting Data for Training and Evaluation
To properly evaluate the performance of your model, divide your dataset into three subgroups:
- Training Set: The largest portion of your data, used to train the model. From this data, the model learns patterns, connections, and characteristics.
- Validation Dataset: A smaller subset of your data used to fine-tune hyperparameters and evaluate the performance of intermediate models. It aids in avoiding overfitting.
- Testing Data: An entirely distinct subset of data that your model has never encountered before. It is employed to assess how effectively your model generalises to fresh, untested data.
2.4 Training the Model and Hyperparameter Tuning
The selected algorithm learns to make predictions or categorize data using the training set. In this phase, the model refines its internal settings to best match the training set of data. Finding the optimal values for hyperparameters (parameters that govern the learning process) that are not learned from the data is known as “hyperparameter tuning.”
Hyperparameter tuning involves experimenting with various hyperparameter settings using the validation set to enhance the performance of the model. This often involves iterative training and validation until you achieve a satisfactory level of performance on the validation set.
2.5 Evaluating Model Performance
The final step is assessing your model’s performance using the test set. Evaluate how successfully the model generates predictions or categorizes the test data. Depending on the type of challenge, a variety of evaluation measures are available:
- Classification: Accuracy, precision, recall, F1-score, ROC curves.
- Regression: R-squared, mean squared error (MSE), root mean squared error (RMSE).
The objectives and specifications of your project will determine the assessment metric you choose. Analyze these metrics to ascertain whether your model performs to the necessary level and is prepared for deployment.
3. Training a Machine Learning Model with Scikit-Learn: A Practical Example
To illustrate the process of training a machine learning model, let’s consider a practical example using Scikit-Learn, a popular machine learning library in Python. We will build an item-based recommendation system that predicts the rating of books using already rated books. This example will guide you through the steps of preparing the data, selecting an algorithm, training the model, and evaluating its performance.
3.1 Dataset Preparation and Cleaning
First, you need to load the dataset into a Pandas DataFrame. For this example, we’ll use a sample dataset from Kaggle, which is a sample from goodread.com.
import pandas as pd
import numpy as np
import matplotlib.pyplot as plt
import seaborn as sns
from sklearn.model_selection import train_test_split, KFold, GridSearchCV
from sklearn.preprocessing import StandardScaler, LabelEncoder
from sklearn.linear_model import LinearRegression
from sklearn.neighbors import KNeighborsRegressor
from sklearn.ensemble import AdaBoostRegressor, GradientBoostingRegressor
from sklearn.svm import LinearSVR, SVR
from sklearn.metrics import mean_squared_error, r2_score
from sklearn.preprocessing import PolynomialFeatures
Load the dataset into a Pandas DataFrame:
books_data = pd.read_csv('books.csv', error_bad_lines=False)Inspect the dataset:
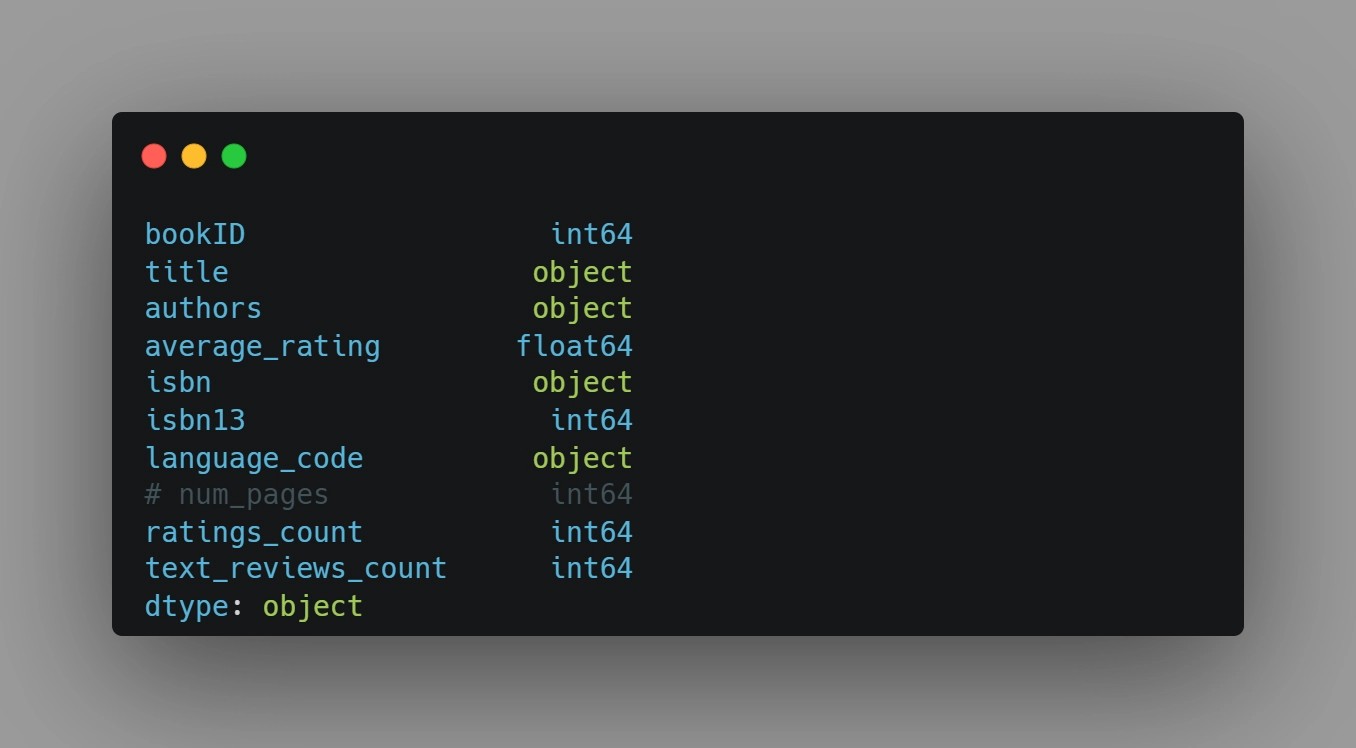
print(books_data.head())
print(books_data.shape)
print(books_data.dtypes)
Check for missing values:
print(books_data.isnull().sum())Rename the ‘num_pages’ column to ‘pages_count’ for easier reference. Also, as bookID, isbn and isbn13 are just unique identifiers so we will delete them as they will not provide any additional information.
books_data.rename(columns={'num_pages': 'pages_count'}, inplace=True)

books_data.drop(['bookID', 'isbn', 'isbn13'], axis=1, inplace=True)
3.2 Algorithm Selection and Exploratory Data Analysis
To select the appropriate algorithm, you need to understand the dataset thoroughly. Let’s perform some Exploratory Data Analysis (EDA) techniques and plot a few graphs to take a closer look at the data points.
Create a heatmap to visualize the correlations between different features:
plt.figure(figsize=(10, 8))
sns.heatmap(books_data.corr(), annot=True, cmap='coolwarm')
plt.title('Correlation Heatmap')
plt.show()
Next, let’s look at the top 10 most rated books in the dataset and display their titles and ratings counts in a table:
top_rated_books = books_data.nlargest(10, 'ratings_count')
print(top_rated_books[['title', 'ratings_count']])
We can also use a bar chart to visualize the top 10 most rated books:
plt.figure(figsize=(12, 6))
sns.barplot(x='ratings_count', y='title', data=top_rated_books, palette='viridis')
plt.title('Top 10 Most Rated Books')
plt.show()
Draw a scatter plot to explore the relationship between average_rating and pages_count:
def scatter_plot(x, y, title, x_label, y_label):
    plt.figure(figsize=(8, 8))
    plt.scatter(x, y)
    plt.title(title)
    plt.xlabel(x_label)
    plt.ylabel(y_label)
    plt.show()

scatter_plot(books_data['average_rating'], books_data['pages_count'],
             'Average Rating vs Pages Count', 'Average Rating', 'Pages Count')
Remove outliers with a pages_count of 2000 or more from the dataset:
books_data = books_data[books_data['pages_count'] < 2000]Focus on books having pages between 1-1500:
limited_by_page_count_books = books_data[(books_data['pages_count'] >= 1) & (books_data['pages_count'] <= 1500)]Identify books with zero as their page count and replace them with the mean value:
print("Count of 0s in pages count column:", (books_data['pages_count'] == 0).sum())
print("Are there any NaNs in pages count column:", books_data['pages_count'].isnull().any())

mean_pages = books_data['pages_count'].mean()
books_data['pages_count'] = books_data['pages_count'].replace(0, mean_pages)
3.3 Preparing the Dataset for Machine Learning
Preprocess categorical data by encoding book titles and author names into numerical format and then applying one-hot encoding to the entire dataset:
encoder = LabelEncoder()
books_data['title'] = encoder.fit_transform(books_data['title'])
books_data['authors'] = encoder.fit_transform(books_data['authors'])

books_data = pd.get_dummies(books_data, columns=['language_code'])
Let’s take a look at a histogram of the target variable: average rating:
plt.figure(figsize=(8, 6))
sns.histplot(books_data['average_rating'], kde=True)
plt.title('Distribution of Average Rating')
plt.show()
3.4 Creating Train, Validation, and Test Datasets
Standardize the dataset, separate features from labels, and then split it into training and validation sets for machine learning model development and evaluation.
scaler = StandardScaler()
books_data_attributes = books_data.drop('average_rating', axis=1)
books_data_labels = books_data['average_rating']

X_train, X_test, y_train, y_test = train_test_split(books_data_attributes, books_data_labels, test_size=0.3, random_state=42)

k_fold = KFold(n_splits=5, shuffle=True, random_state=42)
3.5 Model Training and Performance Analysis
Automate the process of hyperparameter tuning using Grid Search.
def grid_search_best_model(model, params, k_fold, X_train, y_train):
    grid_search = GridSearchCV(model, params, cv=k_fold, scoring='neg_mean_squared_error')
    grid_search.fit(X_train, y_train)
    print("Best params", grid_search.best_params_)
    print("Best estimator", grid_search.best_estimator_)
    print("Best score:", grid_search.best_score_)
    return grid_search.best_estimator_
Define functions for evaluating and comparing the performance of machine learning regression models:
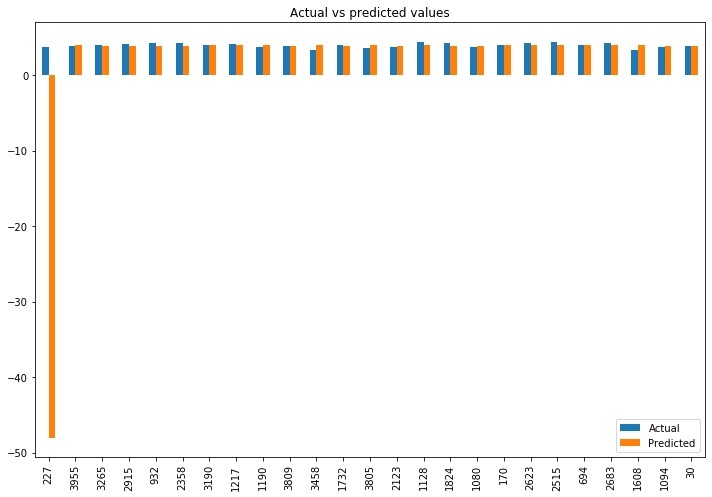
def score_model(model, X_train, X_test, y_train, y_test, model_name, show_plot=True):
    train_score = model.score(X_train, y_train)
    test_score = r2_score(y_test, model.predict(X_test))
    mse = mean_squared_error(y_test, model.predict(X_test))

    print("Training score:", train_score)
    print("Test score:", test_score)
    print("MSE:", mse)

    if show_plot:
        actual_vs_predicted = pd.DataFrame({'Actual': y_test, 'Predicted': model.predict(X_test)})
        sample = actual_vs_predicted.sample(10)
        print(sample)

model_results = {}
3.5.1 Linear Regression
Implement the linear regression model for our dataset:
params = {'fit_intercept': [True, False]}
linear_regression = LinearRegression()
linear_regression = grid_search_best_model(linear_regression, params, k_fold, X_train, y_train)

model_results['linear_regression'] = score_model(linear_regression, X_train, X_test, y_train, y_test, "linear_regression")
3.5.2 K Nearest Neighbour
Train the K-Nearest Neighbor algorithm to solve the given problem statement:
params = {'n_neighbors': [3, 5, 7, 9], 'leaf_size': [10, 20, 30, 40]}
knn = KNeighborsRegressor()
knn = grid_search_best_model(knn, params, k_fold, X_train, y_train)

model_results['knn'] = score_model(knn, X_train, X_test, y_train, y_test, "knn")
3.5.3 Ada Boost Regressor
Implement the Ada Boost Regressor:
params = {'learning_rate': [0.1, 0.5, 1], 'n_estimators': [500, 1000]}
abr = AdaBoostRegressor()
abr = grid_search_best_model(abr, params, k_fold, X_train, y_train)

model_results['abr'] = score_model(abr, X_train, X_test, y_train, y_test, "abr")
3.5.4 Linear Support Vector Regression
Perform hyperparameter tuning for a Linear Support Vector Regressor (LinearSVR) model:
params = {'C': [0.01, 0.1, 1], 'fit_intercept': [True, False]}
linear_svr = LinearSVR()
linear_svr = grid_search_best_model(linear_svr, params, k_fold, X_train, y_train)

model_results['linear_svr'] = score_model(linear_svr, X_train, X_test, y_train, y_test, "linear_svr")
3.5.5 Gradient Boosting Regressor (GBR)
Use Grid Search function for performing hyperparameter tuning for a Gradient Boosting Regressor (GBR) model:
params = {'n_estimators': [50, 100], 'learning_rate': [0.01, 0.05],
          'max_depth': [5, 10], 'min_samples_leaf': [5, 10],
          'max_features': [0.3, 0.6]}
gbr = GradientBoostingRegressor()
gbr = grid_search_best_model(gbr, params, k_fold, X_train, y_train)

model_results['gbr'] = score_model(gbr, X_train, X_test, y_train, y_test, "gbr")
3.5.6 Support Vector Regressor (SVR)
Implement Support Vector Regressor (SVR) with an RBF kernel:
params = {'C': [0.1, 1], 'epsilon': [0.001, 0.01], 'gamma': [0.001, 0.01]}
gaussian_svr = SVR(kernel='rbf')
gaussian_svr = grid_search_best_model(gaussian_svr, params, k_fold, X_train, y_train)

model_results['gaussian_svr'] = score_model(gaussian_svr, X_train, X_test, y_train, y_test, "gaussian_svr")
Attempt to improve the performance of the regression models by transforming the data using polynomial features of the 2nd degree:
poly = PolynomialFeatures(degree=2, interaction_only=True)
books_data_attributes_quad_transformed = poly.fit_transform(books_data_attributes)

X_train_quad_transformed, X_test_quad_transformed, y_train_quad_transformed, y_test_quad_transformed = train_test_split(
    books_data_attributes_quad_transformed, books_data_labels, test_size=0.3, random_state=42)

k_fold_quad_transformed = KFold(n_splits=5, shuffle=True, random_state=42)

params = {'fit_intercept': [True, False]}
linear_regression_quad_transformed = LinearRegression()
linear_regression_quad_transformed = grid_search_best_model(linear_regression_quad_transformed, params, k_fold_quad_transformed, X_train_quad_transformed, y_train_quad_transformed)

model_results['linear_regression_quad_transformed'] = score_model(linear_regression_quad_transformed, X_train_quad_transformed, X_test_quad_transformed, y_train_quad_transformed, y_test_quad_transformed, "linear_regression_quad_transformed")
Continue the process of fine-tuning machine learning models to improve their predictive performance, focusing on the AdaBoostRegressor algorithm applied to data that has been transformed using quadratic features:
params = {'learning_rate': [0.1, 0.5], 'n_estimators': [200, 400]}
abr_quad_transformed = AdaBoostRegressor()
abr_quad_transformed = grid_search_best_model(abr_quad_transformed, params, k_fold_quad_transformed, X_train_quad_transformed, y_train_quad_transformed)

model_results['abr_quad_transformed'] = score_model(abr_quad_transformed, X_train_quad_transformed, X_test_quad_transformed, y_train_quad_transformed, y_test_quad_transformed, "abr_quad_transformed")
Now, fine-tune machine learning models, focusing on the GradientBoostingRegressor algorithm applied to the dataset transformed with quadratic features:
params = {'n_estimators': [50, 100], 'learning_rate': [0.01, 0.05],
          'max_depth': [5, 10], 'min_samples_leaf': [5, 10],
          'max_features': [0.3, 0.6]}
gbr_quad_transformed = GradientBoostingRegressor()
gbr_quad_transformed = grid_search_best_model(gbr_quad_transformed, params, k_fold_quad_transformed, X_train_quad_transformed, y_train_quad_transformed)

model_results['gbr_quad_transformed'] = score_model(gbr_quad_transformed, X_train_quad_transformed, X_test_quad_transformed, y_train_quad_transformed, y_test_quad_transformed, "gbr_quad_transformed")
Call the compare_results() function to analyze the results of the different models we experimented with:
def compare_results(model_results):
    print("Model Comparison:")
    for model_name, result in model_results.items():
        print(f"nModel: {model_name}")
        print(f"  Training score: {result.score(X_train, y_train) if hasattr(result, 'score') else 'N/A'}")
        print(f"  R2 test score: {r2_score(y_test, result.predict(X_test)) if hasattr(result, 'predict') else 'N/A'}")
        print(f"  MSE test score: {mean_squared_error(y_test, result.predict(X_test)) if hasattr(result, 'predict') else 'N/A'}")

compare_results(model_results)
3.6 Analysis and Model Selection
Based on our analysis, the GradientBoostingRegressor with preprocessed data (utilizing second-degree polynomials) achieved the highest performance on the test data, scoring approximately 19%. It also demonstrated decent performance on the training data, with a score of about 53%.
4. Mastering Machine Learning Model Training with LEARNS.EDU.VN
To master the art of training machine learning models, practical experience is invaluable. At LEARNS.EDU.VN, we offer a range of resources to help you develop your skills and knowledge in this area. By experimenting with a variety of datasets and algorithms, you can enhance your adaptability and expertise in machine learning.
4.1 Discover Practical Examples and Real-World Projects
LEARNS.EDU.VN provides access to practical examples and real-world projects that allow you to refine your model training skills. Whether you’re a beginner or an experienced practitioner, our resources cater to all skill levels.
Our project repository includes:
- Data Science Projects: Gain hands-on experience with diverse datasets and cutting-edge algorithms.
- Big Data Projects: Learn how to process and analyze large datasets using state-of-the-art big data technologies.
4.2 Enhance Your Skills with Comprehensive Learning Resources
LEARNS.EDU.VN offers a comprehensive collection of solved projects, tutorials, and courses in data science and big data. Our resources span various domains, from image recognition to predictive analytics, providing hands-on experience with diverse datasets and algorithms.
We also offer:
- Step-by-step guides: Detailed instructions on how to approach and solve machine learning problems.
- Code examples: Ready-to-use code snippets that you can incorporate into your projects.
- Expert support: Access to experienced instructors who can answer your questions and provide guidance.
4.3 Get Job-Ready with LEARNS.EDU.VN
By leveraging the resources at LEARNS.EDU.VN, you can enhance your resume and boost your career prospects in the field of machine learning. Join us today and start your journey of growth and discovery in the world of machine learning.
Visit LEARNS.EDU.VN to explore our courses and resources.
5. FAQs About Training Machine Learning Models
5.1 Why is it important to inspect your data before selecting and training a machine learning model?
Inspecting input data helps identify issues like missing values, outliers, or imbalances. Addressing these issues before model training ensures better model performance and avoids biased or unreliable results.
5.2 What is the purpose of splitting data before training a machine learning model?
Splitting data allows assessing a model’s performance on unseen data. The data is split into training and testing subsets, where the training set teaches the model, and the test set evaluates its ability to generalize, preventing overfitting.
5.3 In training a machine learning model, what does the term “loss function” mean?
A loss function measures the model’s prediction error by comparing its output to the actual target values. During training, the model aims to minimize this error, adjusting its parameters to improve accuracy.
5.4 What are training and test sets in a machine learning model?
The training set is used to train the model, while the test set is reserved for evaluating the model’s performance. This separation ensures that the model’s effectiveness is assessed on data it has never seen, helping gauge its real-world applicability.
5.5 How does hyperparameter tuning improve model performance?
Hyperparameter tuning involves selecting the best set of hyperparameters for a learning algorithm. These parameters are not learned from data but are set prior to training. Techniques like Grid Search and Random Search help find the optimal hyperparameter values, leading to better model performance.
5.6 What are common evaluation metrics for classification and regression models?
- Classification: Accuracy, precision, recall, F1-score, ROC AUC.
- Regression: Mean Squared Error (MSE), Root Mean Squared Error (RMSE), R-squared.
5.7 What is overfitting and how can it be prevented?
Overfitting occurs when a model learns the training data too well, capturing noise and outliers, which results in poor performance on new, unseen data. It can be prevented through techniques like cross-validation, regularization, and using simpler models.
5.8 Why is feature scaling important in machine learning?
Feature scaling ensures that all features contribute equally to the model’s learning process. It prevents features with larger values from dominating those with smaller values, leading to more accurate and stable models.
5.9 How can I choose the right machine learning algorithm for my problem?
Consider the type of problem (classification, regression, clustering), the size and nature of your data, and the interpretability requirements. Experiment with different algorithms and evaluate their performance using appropriate metrics.
5.10 What are some common machine learning algorithms?
- Linear Regression: For regression tasks.
- Logistic Regression: For binary classification tasks.
- Decision Trees: For both classification and regression.
- Random Forest: An ensemble of decision trees, often providing high accuracy.
- Support Vector Machines (SVM): Effective for classification and regression.
- K-Means Clustering: For unsupervised clustering tasks.
At LEARNS.EDU.VN, we aim to equip you with the knowledge and skills necessary to excel in the field of machine learning. Contact us at:
- Address: 123 Education Way, Learnville, CA 90210, United States
- WhatsApp: +1 555-555-1212
- Website: LEARNS.EDU.VN
Begin your journey towards mastering machine learning today with learns.edu.vn!