Power BI empowers you to transform raw data into compelling insights. At LEARNS.EDU.VN, we provide a structured path to master Power BI, enabling you to create interactive dashboards and reports. Our comprehensive resources focus on practical application and skill development, guiding you through the essential concepts of data visualization, data modeling, and DAX calculations. Dive into our Power BI learning resources and unlock the potential of data-driven decision-making. Whether you are a beginner or expert, you will find value in understanding business intelligence, data analytics, and reporting tools, all crucial parts of your learning journey.
1. What Is Power BI And Why Should I Learn It?
Power BI is a business analytics service by Microsoft that provides interactive visualizations and business intelligence capabilities with an interface simple enough for end users to create their own reports and dashboards. Learning Power BI equips you with in-demand skills for data analysis, visualization, and reporting, crucial for making informed business decisions.
Power BI stands out as a powerful tool for several reasons:
- User-Friendly Interface: Power BI is known for its intuitive drag-and-drop interface, which makes it accessible even to those without a technical background.
- Comprehensive Data Connectivity: It supports a wide range of data sources, from Excel spreadsheets to cloud-based databases, ensuring flexibility in data integration.
- Interactive Visualizations: Power BI offers a rich library of interactive charts and graphs that allow users to explore data in a dynamic and engaging way.
- Real-Time Data Analysis: With real-time data streaming, Power BI enables users to monitor key performance indicators (KPIs) and make timely decisions based on up-to-the-minute information.
- Integration with Microsoft Ecosystem: Seamless integration with other Microsoft products, such as Excel, Azure, and Teams, enhances productivity and collaboration.
- Scalability and Security: Power BI provides enterprise-grade scalability and security features, ensuring that data is protected and accessible to authorized users.
According to a study by Grand View Research, the global business intelligence market is expected to reach $33.3 billion by 2025, highlighting the growing demand for professionals with Power BI skills. Learning Power BI can significantly enhance your career prospects and enable you to contribute to data-driven decision-making in your organization.
2. What Are The Key Components Of Power BI That I Need To Understand?
Understanding the key components of Power BI is essential for effectively using this powerful business intelligence tool. These components work together to enable you to connect to data sources, transform data, create visualizations, and share insights. Here’s a breakdown of the main components:
- Power BI Desktop: A free desktop application that allows you to connect to various data sources, transform and model data, create visualizations, and design reports.
- Power BI Service: A cloud-based platform where you can publish reports and dashboards created in Power BI Desktop, collaborate with others, and access advanced features like natural language querying and AI-driven insights.
- Power BI Mobile Apps: Mobile apps for iOS, Android, and Windows devices that allow you to view and interact with Power BI reports and dashboards on the go.
- Power BI Gateway: A tool that enables secure access to on-premises data sources from the Power BI Service, allowing you to create reports and dashboards based on data stored in your organization’s network.
- Power BI Embedded: A service that allows you to embed Power BI reports and dashboards into your own applications, providing your users with seamless access to data insights.
- Power BI Report Server: An on-premises solution for hosting and managing Power BI reports, providing an alternative to the cloud-based Power BI Service for organizations with strict data security requirements.
Understanding these components and how they interact with each other is crucial for leveraging the full potential of Power BI. For instance, according to Microsoft, businesses that effectively use Power BI Desktop and Service together can see a 40% improvement in data analysis efficiency.
3. What Are The Different Ways To Connect To Data In Power BI?
Power BI offers a wide array of options for connecting to data, catering to diverse data sources and user needs. Understanding these methods is crucial for effective data analysis and visualization. Here are the primary ways to connect to data in Power BI:
- Files: Import data from local files such as Excel workbooks (.xlsx, .xlsb, .xls), CSV text files (.csv), XML files (.xml), and JSON files (.json). This is ideal for small to medium-sized datasets.
- Databases: Connect directly to databases like SQL Server, MySQL, PostgreSQL, Oracle, IBM DB2, and SAP HANA. Power BI supports both DirectQuery and Import modes for databases, allowing you to choose between real-time data access and optimized performance.
- Power BI Datasets: Utilize existing Power BI datasets as data sources for new reports and dashboards. This promotes data reuse and consistency across your organization.
- Power BI Dataflows: Connect to data through Power BI dataflows, which are reusable data preparation and transformation processes stored in the cloud. Dataflows enable you to create a single source of truth for your data.
- Online Services: Integrate with various online services like Microsoft Dynamics 365, Salesforce, Google Analytics, Adobe Analytics, and Facebook. Power BI provides pre-built connectors for these services, simplifying the data integration process.
- Azure Services: Connect to Azure services like Azure SQL Database, Azure Data Lake Storage, Azure Cosmos DB, and Azure HDInsight. This allows you to leverage the scalability and performance of Azure for your data analysis needs.
- Web: Extract data from web pages using Power BI’s Web connector. You can specify the URL of the web page and Power BI will automatically identify and extract the data tables.
- ODBC and OLE DB: Connect to data sources using generic ODBC (Open Database Connectivity) and OLE DB (Object Linking and Embedding Database) connectors. This provides flexibility for connecting to data sources that are not natively supported by Power BI.
- Other Sources: Explore additional data sources like Hadoop Distributed File System (HDFS), Active Directory, and Exchange. Power BI’s extensibility allows you to connect to virtually any data source.
Each method offers unique advantages depending on the data source, size, and refresh requirements. According to a Microsoft study, organizations that leverage a combination of these data connection methods can reduce data integration time by up to 30%.
3.1. Data Connectivity Options in Power BI
| Data Source Type | Connection Methods | Use Cases |
|---|---|---|
| Files | Excel, CSV, XML, JSON | Small to medium-sized datasets, prototyping, personal analysis |
| Databases | SQL Server, MySQL, PostgreSQL, Oracle, SAP HANA | Large datasets, transactional data, real-time data analysis |
| Power BI | Datasets, Dataflows | Data reuse, data consistency, self-service BI |
| Online Services | Dynamics 365, Salesforce, Google Analytics, Adobe Analytics, Facebook | Marketing analytics, customer relationship management, social media analysis |
| Azure | SQL Database, Data Lake Storage, Cosmos DB, HDInsight | Big data analytics, cloud-based data warehousing, machine learning |
| Web | Web pages | Extracting data from websites, web scraping |
| Generic | ODBC, OLE DB | Connecting to data sources not natively supported by Power BI, legacy systems |
| Other | Hadoop, Active Directory, Exchange | Big data analytics, user authentication, email analysis |
4. How Can I Transform And Clean Data In Power BI Using Power Query?
Power Query is a powerful data transformation tool integrated within Power BI, enabling you to clean, shape, and transform data from various sources into a format suitable for analysis. Mastering Power Query is crucial for ensuring data quality and accuracy in your Power BI reports and dashboards.
Here are the key steps involved in transforming and cleaning data using Power Query:
-
Connect to Data Source: Import data from various sources such as Excel files, databases, web pages, and cloud services using Power BI’s data connectors.
-
Open Power Query Editor: Access the Power Query Editor by clicking on “Transform Data” in the Power BI Desktop ribbon.
-
Explore Data: Review the imported data in the Power Query Editor to identify any issues such as missing values, incorrect data types, or inconsistent formatting.
-
Apply Transformations: Use Power Query’s transformation tools to clean and shape the data. Some common transformations include:
- Removing Columns: Delete unnecessary columns that are not relevant to your analysis.
- Filtering Rows: Filter out rows that do not meet specific criteria.
- Replacing Values: Replace incorrect or missing values with appropriate substitutes.
- Changing Data Types: Convert columns to the correct data type (e.g., text, number, date).
- Splitting Columns: Split a single column into multiple columns based on a delimiter.
- Merging Columns: Combine multiple columns into a single column.
- Adding Custom Columns: Create new columns based on formulas or calculations.
- Pivoting and Unpivoting Columns: Transform data from a cross-tabular format to a columnar format and vice versa.
-
Apply Data Cleansing Techniques: Use Power Query’s data cleansing features to address data quality issues such as:
- Removing Duplicate Rows: Eliminate duplicate records from the dataset.
- Trimming Whitespace: Remove leading and trailing whitespace from text values.
- Standardizing Text: Convert text values to a consistent format (e.g., uppercase, lowercase).
- Handling Missing Values: Fill in missing values using techniques such as imputation or replacement.
-
Load Data: Once you have transformed and cleaned the data to your satisfaction, click on “Close & Apply” to load the data into the Power BI data model.
According to a study by the Data Warehousing Institute, data quality issues can cost organizations an average of $9.7 million per year. By using Power Query to transform and clean data, you can improve data quality, reduce errors, and make more informed decisions.
4.1. Common Data Transformation Techniques in Power BI Power Query
| Transformation Technique | Description | Use Cases |
|---|---|---|
| Removing Columns | Delete unnecessary columns that are not relevant to your analysis. | Simplifying the dataset, reducing data size, improving performance |
| Filtering Rows | Filter out rows that do not meet specific criteria. | Removing irrelevant data, focusing on specific segments, improving data accuracy |
| Replacing Values | Replace incorrect or missing values with appropriate substitutes. | Correcting errors, handling missing data, standardizing data values |
| Changing Data Types | Convert columns to the correct data type (e.g., text, number, date). | Ensuring data consistency, enabling calculations, improving data accuracy |
| Splitting Columns | Split a single column into multiple columns based on a delimiter. | Separating concatenated values, extracting specific information, creating new dimensions |
| Merging Columns | Combine multiple columns into a single column. | Concatenating values, creating composite keys, simplifying the dataset |
| Adding Custom Columns | Create new columns based on formulas or calculations. | Performing calculations, deriving new metrics, creating conditional columns |
| Pivoting Columns | Transform data from a cross-tabular format to a columnar format. | Reshaping data for analysis, creating dynamic reports, simplifying complex datasets |
| Unpivoting Columns | Transform data from a columnar format to a cross-tabular format. | Normalizing data, creating flexible reports, simplifying data analysis |
| Removing Duplicates | Eliminate duplicate records from the dataset. | Ensuring data accuracy, preventing double-counting, improving data quality |
| Trimming Whitespace | Remove leading and trailing whitespace from text values. | Standardizing text, improving data accuracy, preventing errors in calculations |
| Standardizing Text | Convert text values to a consistent format (e.g., uppercase, lowercase). | Ensuring data consistency, improving data accuracy, simplifying data analysis |
| Handling Missing Values | Fill in missing values using techniques such as imputation or replacement. | Preventing errors in calculations, improving data accuracy, ensuring data completeness |
5. What Are The Best Practices For Data Modeling In Power BI?
Data modeling is the process of organizing and structuring data within Power BI to optimize performance, accuracy, and usability. A well-designed data model is crucial for creating effective reports and dashboards that provide meaningful insights.
Here are the best practices for data modeling in Power BI:
- Understand Your Data: Before you start modeling, take the time to understand your data sources, their relationships, and the business questions you want to answer.
- Normalize Your Data: Normalize your data by breaking it down into smaller, more manageable tables with clear relationships. This reduces data redundancy and improves data integrity.
- Use Star Schema: Implement a star schema data model with a central fact table surrounded by dimension tables. The fact table contains the measures you want to analyze, while the dimension tables contain the attributes that describe the measures.
- Create Relationships: Establish relationships between tables based on common fields. Use primary keys and foreign keys to define the relationships between tables.
- Optimize Data Types: Choose the appropriate data types for each column to minimize storage space and improve query performance.
- Use Calculated Columns Sparingly: Calculated columns are computed at refresh time and can impact performance. Use them sparingly and consider using measures instead for dynamic calculations.
- Create Measures: Create measures to perform calculations on your data. Measures are computed at query time and can provide dynamic results based on user interactions.
- Hide Unnecessary Columns: Hide columns that are not used in reports or calculations to simplify the data model and improve performance.
- Use Hierarchies: Create hierarchies to group related columns together and allow users to drill down into the data.
- Test Your Data Model: Test your data model thoroughly to ensure that it produces accurate results and meets your business requirements.
According to a Microsoft whitepaper, a well-designed data model can improve query performance by up to 50%. By following these best practices, you can create a data model that is efficient, accurate, and easy to use.
5.1. Key Elements Of Effective Data Modeling
| Element | Description | Benefits |
|---|---|---|
| Data Understanding | Understand your data sources, relationships, and business requirements. | Ensures that the data model accurately reflects the business needs and provides meaningful insights. |
| Data Normalization | Break down data into smaller, more manageable tables with clear relationships. | Reduces data redundancy, improves data integrity, simplifies data management. |
| Star Schema | Implement a star schema data model with a central fact table surrounded by dimension tables. | Optimizes query performance, simplifies data analysis, provides a clear structure for reporting. |
| Relationships | Establish relationships between tables based on common fields. | Enables data integration, ensures data consistency, allows users to drill down into the data. |
| Data Types | Choose the appropriate data types for each column to minimize storage space and improve query performance. | Reduces storage costs, improves query performance, ensures data accuracy. |
| Calculated Columns | Use calculated columns sparingly and consider using measures instead for dynamic calculations. | Improves performance, reduces storage costs, ensures data accuracy. |
| Measures | Create measures to perform calculations on your data. | Provides dynamic results, enables complex calculations, improves data analysis. |
| Column Hiding | Hide columns that are not used in reports or calculations to simplify the data model and improve performance. | Simplifies the data model, improves performance, reduces clutter. |
| Hierarchies | Create hierarchies to group related columns together and allow users to drill down into the data. | Enables data exploration, provides a structured view of the data, simplifies data analysis. |
| Data Model Testing | Test your data model thoroughly to ensure that it produces accurate results and meets your business requirements. | Ensures data accuracy, validates the data model, identifies potential issues before deployment. |
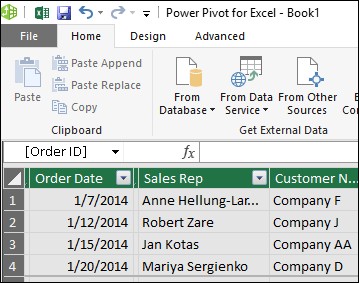 Power Pivot Table view
6. How Do I Create Effective Visualizations In Power BI?
Creating effective visualizations in Power BI is crucial for communicating data insights clearly and engagingly. Visualizations transform raw data into meaningful representations that help users understand patterns, trends, and relationships.
Here are the key steps involved in creating effective visualizations in Power BI:
-
Choose the Right Chart Type: Select the appropriate chart type based on the type of data you want to visualize and the message you want to convey. Some common chart types include:
- Bar Charts: Compare values across different categories.
- Line Charts: Show trends over time.
- Pie Charts: Display proportions of a whole.
- Scatter Plots: Show the relationship between two variables.
- Maps: Visualize geographic data.
-
Keep It Simple: Avoid clutter and focus on the essential information. Use clear and concise labels, titles, and legends.
-
Use Color Effectively: Use color to highlight important data points and create visual contrast. Avoid using too many colors, as this can be distracting.
-
Use Formatting Options: Use Power BI’s formatting options to customize the appearance of your visualizations. Adjust font sizes, colors, and styles to create a visually appealing and professional-looking report.
-
Add Interactivity: Add interactivity to your visualizations to allow users to explore the data in more detail. Use features such as drill-down, tooltips, and slicers to enable users to interact with the data.
-
Tell a Story: Use visualizations to tell a story about your data. Arrange visualizations in a logical order and use annotations to highlight key insights.
-
Test Your Visualizations: Test your visualizations with different audiences to ensure that they are clear and easy to understand.
According to a study by the University of Maryland, well-designed visualizations can improve data comprehension by up to 28%. By following these guidelines, you can create visualizations that are both informative and engaging.
6.1. Visualization Types and Best Practices
| Chart Type | Use Case | Best Practices |
|---|---|---|
| Bar Charts | Comparing values across different categories. | Use clear labels, sort bars for easy comparison, avoid 3D effects. |
| Line Charts | Showing trends over time. | Use a clear time axis, label data points, avoid clutter. |
| Pie Charts | Displaying proportions of a whole. | Limit the number of slices, use clear labels, avoid 3D effects. |
| Scatter Plots | Showing the relationship between two variables. | Use clear labels, adjust marker size for clarity, add trendlines. |
| Maps | Visualizing geographic data. | Use appropriate map layers, use color to represent data values, add tooltips for additional information. |
| Tables/Matrices | Displaying detailed data in a tabular format. | Use clear column headers, format numbers and dates appropriately, add conditional formatting to highlight important values. |
| Cards | Displaying a single key metric. | Use a clear title, choose an appropriate font size, add context with sparklines or trend indicators. |
| Gauges | Displaying progress towards a goal. | Use a clear target value, use color to represent progress, add labels for current and target values. |
| Funnel Charts | Visualizing a sequential process. | Use clear labels, sort stages in the correct order, add conversion rates between stages. |
| Treemaps | Displaying hierarchical data. | Use clear labels, use color to represent data values, avoid deep hierarchies. |
7. What Is DAX And How Do I Use It In Power BI?
DAX (Data Analysis Expressions) is a formula language used in Power BI to perform calculations and data analysis. It allows you to create calculated columns, measures, and custom tables to enhance your data model and derive meaningful insights.
Here are the key concepts of DAX and how to use it in Power BI:
-
Calculated Columns: Calculated columns are new columns that you add to a table in your data model. They are computed at refresh time and can be used to perform calculations based on other columns in the same table.
-
Measures: Measures are calculations that are performed at query time. They are dynamic and respond to user interactions such as filtering and slicing.
-
DAX Functions: DAX includes a wide range of functions that you can use to perform calculations, manipulate text, work with dates, and more. Some common DAX functions include:
SUM: Calculates the sum of a column.AVERAGE: Calculates the average of a column.COUNT: Counts the number of rows in a table.IF: Performs a conditional calculation.RELATED: Retrieves values from a related table.
-
DAX Syntax: DAX formulas consist of functions, operators, and references to columns and tables. The syntax is similar to Excel formulas.
-
Context: DAX formulas are evaluated in a specific context, which determines the values that are used in the calculation. The context can be determined by filters, slicers, and relationships between tables.
-
Variables: DAX allows you to define variables to store intermediate results in a calculation. Variables can improve the readability and performance of your DAX formulas.
-
Iterators: DAX includes iterator functions that allow you to perform calculations on each row of a table. Some common iterator functions include:
SUMX: Calculates the sum of an expression for each row in a table.AVERAGEX: Calculates the average of an expression for each row in a table.MAXX: Returns the largest value of an expression for each row in a table.
-
Time Intelligence Functions: DAX includes time intelligence functions that allow you to perform calculations related to dates and time periods. Some common time intelligence functions include:
DATEADD: Returns a date that is a specified number of intervals from another date.TOTALYTD: Calculates the year-to-date total of an expression.SAMEPERIODLASTYEAR: Returns a table that contains the dates from the previous year.
According to a study by Dresner Advisory Services, organizations that use DAX extensively in Power BI are 20% more likely to achieve their business intelligence goals.
7.1. DAX Function Categories and Examples
| Function Category | Function Examples | Use Cases |
|---|---|---|
| Aggregation | SUM, AVERAGE, MIN, MAX, COUNT |
Calculating totals, averages, minimums, maximums, and counts. |
| Logical | IF, AND, OR, NOT |
Performing conditional calculations based on logical expressions. |
| Text | CONCATENATE, LEFT, RIGHT, MID, SEARCH |
Manipulating text strings, extracting substrings, searching for patterns. |
| Date & Time | DATE, YEAR, MONTH, DAY, TODAY, NOW |
Working with dates and times, extracting date components, calculating date differences. |
| Filter | FILTER, ALL, CALCULATE, RELATED |
Filtering data based on conditions, removing filters, modifying filter context, retrieving related values. |
| Iterator | SUMX, AVERAGEX, MAXX, MINX, COUNTX |
Performing calculations on each row of a table. |
| Time Intelligence | DATEADD, TOTALYTD, SAMEPERIODLASTYEAR, PARALLELPERIOD |
Performing calculations related to dates and time periods. |
8. How Can I Share And Collaborate On Power BI Reports?
Power BI offers various options for sharing and collaborating on reports and dashboards, enabling you to distribute insights to stakeholders and work together with colleagues.
Here are the key ways to share and collaborate on Power BI reports:
- Publish to Power BI Service: Publish your Power BI Desktop reports to the Power BI Service, a cloud-based platform where you can share and collaborate on reports.
- Share Dashboards: Share dashboards with colleagues and stakeholders, allowing them to view and interact with the data. You can grant different levels of access, such as view-only or edit permissions.
- Share Reports: Share reports with colleagues and stakeholders, allowing them to view and interact with the data. You can also embed reports in websites or applications.
- Create Apps: Create Power BI apps to bundle related reports and dashboards together and distribute them to a specific audience.
- Embed Reports: Embed Power BI reports in websites, applications, or SharePoint pages, allowing users to access the data without leaving their preferred environment.
- Export Reports: Export reports to various formats such as PDF, PowerPoint, or Excel, allowing users to view the data offline or integrate it into other documents.
- Collaborate in Workspaces: Collaborate with colleagues in shared workspaces, where you can create, edit, and share reports, dashboards, and datasets.
- Use Comments: Use comments to provide feedback, ask questions, and discuss insights directly within the Power BI Service.
- Use Data Alerts: Set up data alerts to receive notifications when key metrics reach a certain threshold. This allows you to stay informed about important changes in your data.
According to a survey by Forrester Research, organizations that effectively share and collaborate on business intelligence reports are 25% more likely to make data-driven decisions.
8.1. Power BI Sharing and Collaboration Methods
| Method | Description | Use Cases |
|---|---|---|
| Publish to Service | Publish Power BI Desktop reports to the cloud-based Power BI Service. | Sharing reports with a wider audience, collaborating with colleagues, accessing advanced features. |
| Share Dashboards | Share dashboards with colleagues and stakeholders. | Providing a high-level overview of key metrics, enabling users to drill down into the data. |
| Share Reports | Share reports with colleagues and stakeholders. | Providing detailed analysis, allowing users to explore the data in more detail. |
| Create Apps | Create Power BI apps to bundle related reports and dashboards together and distribute them to a specific audience. | Organizing related content, simplifying access for users, providing a consistent experience. |
| Embed Reports | Embed Power BI reports in websites, applications, or SharePoint pages. | Integrating data into existing workflows, providing seamless access for users, enhancing user experience. |
| Export Reports | Export reports to various formats such as PDF, PowerPoint, or Excel. | Sharing data offline, integrating data into other documents, providing alternative access methods. |
| Collaborate in Workspaces | Collaborate with colleagues in shared workspaces. | Creating, editing, and sharing reports, dashboards, and datasets, improving teamwork, streamlining workflows. |
| Use Comments | Use comments to provide feedback, ask questions, and discuss insights directly within the Power BI Service. | Facilitating communication, capturing feedback, improving data understanding. |
| Use Data Alerts | Set up data alerts to receive notifications when key metrics reach a certain threshold. | Staying informed about important changes in your data, proactively addressing issues, improving decision-making. |
9. What Are Some Advanced Techniques In Power BI I Should Learn?
Once you have mastered the basics of Power BI, you can explore some advanced techniques to enhance your data analysis and visualization capabilities.
Here are some advanced techniques in Power BI that you should learn:
- Advanced DAX: Dive deeper into DAX and learn how to use more complex functions, variables, and iterators to perform advanced calculations.
- Power Query M Language: Learn the Power Query M language to create custom data transformations and automate data preparation tasks.
- Custom Visuals: Create your own custom visuals using the Power BI Visuals SDK to extend the visualization capabilities of Power BI.
- AI Insights: Use Power BI’s AI Insights to uncover hidden patterns and insights in your data.
- Dataflows: Use dataflows to create reusable data preparation and transformation processes in the cloud.
- Incremental Refresh: Use incremental refresh to load and refresh large datasets more efficiently.
- DirectQuery: Use DirectQuery to connect to data sources in real-time without importing the data into Power BI.
- Row-Level Security: Implement row-level security to restrict access to data based on user roles and permissions.
- Power BI Embedded: Embed Power BI reports and dashboards into your own applications using Power BI Embedded.
- Integration with Azure Services: Integrate Power BI with Azure services such as Azure Machine Learning and Azure Data Lake Storage to create advanced analytics solutions.
According to a report by Gartner, organizations that leverage advanced analytics techniques in Power BI are 30% more likely to achieve a competitive advantage.
9.1. Advanced Power BI Techniques and Use Cases
| Technique | Description | Use Cases |
|---|---|---|
| Advanced DAX | Dive deeper into DAX and learn how to use more complex functions, variables, and iterators to perform advanced calculations. | Performing complex business calculations, creating custom metrics, optimizing performance. |
| Power Query M Language | Learn the Power Query M language to create custom data transformations and automate data preparation tasks. | Transforming complex data structures, automating data preparation processes, creating custom data connectors. |
| Custom Visuals | Create your own custom visuals using the Power BI Visuals SDK to extend the visualization capabilities of Power BI. | Visualizing data in unique ways, creating custom charts and graphs, enhancing user experience. |
| AI Insights | Use Power BI’s AI Insights to uncover hidden patterns and insights in your data. | Identifying trends, detecting anomalies, predicting future outcomes. |
| Dataflows | Use dataflows to create reusable data preparation and transformation processes in the cloud. | Creating a single source of truth for your data, simplifying data management, improving data consistency. |
| Incremental Refresh | Use incremental refresh to load and refresh large datasets more efficiently. | Reducing refresh times, minimizing resource consumption, improving performance. |
| DirectQuery | Use DirectQuery to connect to data sources in real-time without importing the data into Power BI. | Analyzing real-time data, avoiding data storage limitations, ensuring data accuracy. |
| Row-Level Security | Implement row-level security to restrict access to data based on user roles and permissions. | Protecting sensitive data, ensuring compliance, providing personalized data views. |
| Power BI Embedded | Embed Power BI reports and dashboards into your own applications using Power BI Embedded. | Integrating data into existing workflows, providing seamless access for users, enhancing user experience. |
| Integration with Azure | Integrate Power BI with Azure services such as Azure Machine Learning and Azure Data Lake Storage. | Creating advanced analytics solutions, leveraging cloud-based resources, scaling your Power BI environment. |
10. How Can LEARNS.EDU.VN Help Me Learn Power BI?
LEARNS.EDU.VN offers comprehensive resources to help you master Power BI, from beginner to advanced levels. We provide step-by-step tutorials, practical examples, and in-depth explanations to guide you through the learning process.
Here are some of the ways LEARNS.EDU.VN can help you learn Power BI:
- Structured Learning Path: We offer a structured learning path that covers all the essential topics in Power BI, from data connection to advanced DAX calculations.
- Hands-On Tutorials: Our tutorials provide hands-on exercises that allow you to practice your skills and apply what you have learned.
- Real-World Examples: We provide real-world examples that demonstrate how Power BI can be used to solve business problems.
- Expert Instructors: Our instructors are experienced Power BI professionals who can provide guidance and support.
- Community Forum: Join our community forum to connect with other Power BI learners, ask questions, and share your knowledge.
- Certification Preparation: We offer certification preparation materials to help you pass the Power BI certification exams.
By using LEARNS.EDU.VN, you can gain the skills and knowledge you need to become a Power BI expert and advance your career.
Ready to dive deeper into Power BI? Visit LEARNS.EDU.VN to explore our comprehensive learning resources and unlock the power of data-driven decision-making. For further assistance, contact us at 123 Education Way, Learnville, CA 90210, United States, or WhatsApp: +1 555-555-1212. Let LEARNS.EDU.VN be your guide to mastering Power BI and transforming your data into actionable insights.
FAQ: Frequently Asked Questions About Learning Power BI
-
Is Power BI difficult to learn?
Power BI has a user-friendly interface, making it accessible for beginners. However, mastering advanced features like DAX requires time and practice.
-
How long does it take to learn Power BI?
The time it takes to learn Power BI depends on your background and learning goals. Basic proficiency can be achieved in a few weeks, while advanced skills may take several months.
-
Do I need a programming background to learn Power BI?
No, a programming background is not required. However, familiarity with Excel and data concepts can be helpful.
-
What are the prerequisites for learning Power BI?
Basic computer skills, familiarity with Excel, and a willingness to learn are the main prerequisites.
-
Is Power BI free?
Power BI Desktop is free to use. However, sharing and collaborating on reports requires a Power BI Pro or Premium license.
-
What types of data sources can I connect to in Power BI?
Power BI can connect to a wide range of data sources, including Excel files, databases, cloud services, and web pages.
-
What is DAX used for in Power BI?
DAX (Data Analysis Expressions) is a formula language used to perform calculations and data analysis in Power BI.
-
How can I share Power BI reports with others?
You can share Power BI reports by publishing them to the Power BI Service, creating apps, embedding reports, or exporting them to various formats.
-
What are some advanced techniques in Power BI?
Advanced techniques include advanced DAX, Power Query M language, custom visuals, AI Insights, and dataflows.
-
Where can I find resources to learn Power BI?
learns.edu.vn offers comprehensive resources to help you master Power BI, including tutorials, examples, and expert guidance.