The F1 score in machine learning assesses a model’s accuracy, particularly in classification tasks, by balancing precision and recall, offering a comprehensive measure of performance. At LEARNS.EDU.VN, we help you understand these essential metrics for better model evaluation and improvement. This article explores the F1 score, its interpretation, applications, and limitations, providing you with the knowledge to optimize your machine learning models. Learn about balanced accuracy, performance metrics, and model optimization to achieve superior results.
1. Why Are Evaluation Metrics Important in Machine Learning?
Evaluation metrics are vital for enhancing the precision, effectiveness, and overall excellence of machine learning models. They provide measurable standards for assessing performance.
Evaluation metrics in machine learning (ML) provide:
- Insights into Model Performance: They assess data quality, accuracy, types of errors, bias, and fairness.
- Reliability and Correctness Assessments: They check the reliability and accuracy of model predictions.
- Guidance in Model Selection: They allow equitable comparisons between different model options.
- Informed Hyperparameter Tuning: They guide the fine-tuning of model settings.
- Identification of Model Limitations: They pinpoint weaknesses in the model.
- Support for Stakeholder Decisions: They assist decision-makers with clear performance data.
Using multiple metrics is standard since a model may excel in one area and underperform in another. Practitioners strive to balance these metrics to achieve optimal results.
1.1 How Do Evaluation Metrics Vary Across Different ML Tasks?
Different ML tasks have distinct objectives, and their models have unique parameters. Therefore, no single evaluation approach fits all ML models. Examples include:
- Classification: Employs metrics such as accuracy, precision, recall, F1 score, and AUC-ROC.
- Regression: Utilizes metrics like Mean Squared Error (MSE), Root Mean Squared Error (RMSE), Mean Absolute Error (MAE), and R-squared.
- Clustering: Evaluated using metrics like the Silhouette score, Dunn index, and Rand index.
- Ranking & Recommendation: Uses metrics such as MAP, NDCG, and precision at K.
Evaluation metrics vary across different ML tasks
2. What Are the Fundamentals of Classification Metrics?
Classification tasks typically fall into two categories: binary classification (datasets with two classes) and multi-class classification (datasets with more than two classes). Classifiers predict labels or classes for given data.
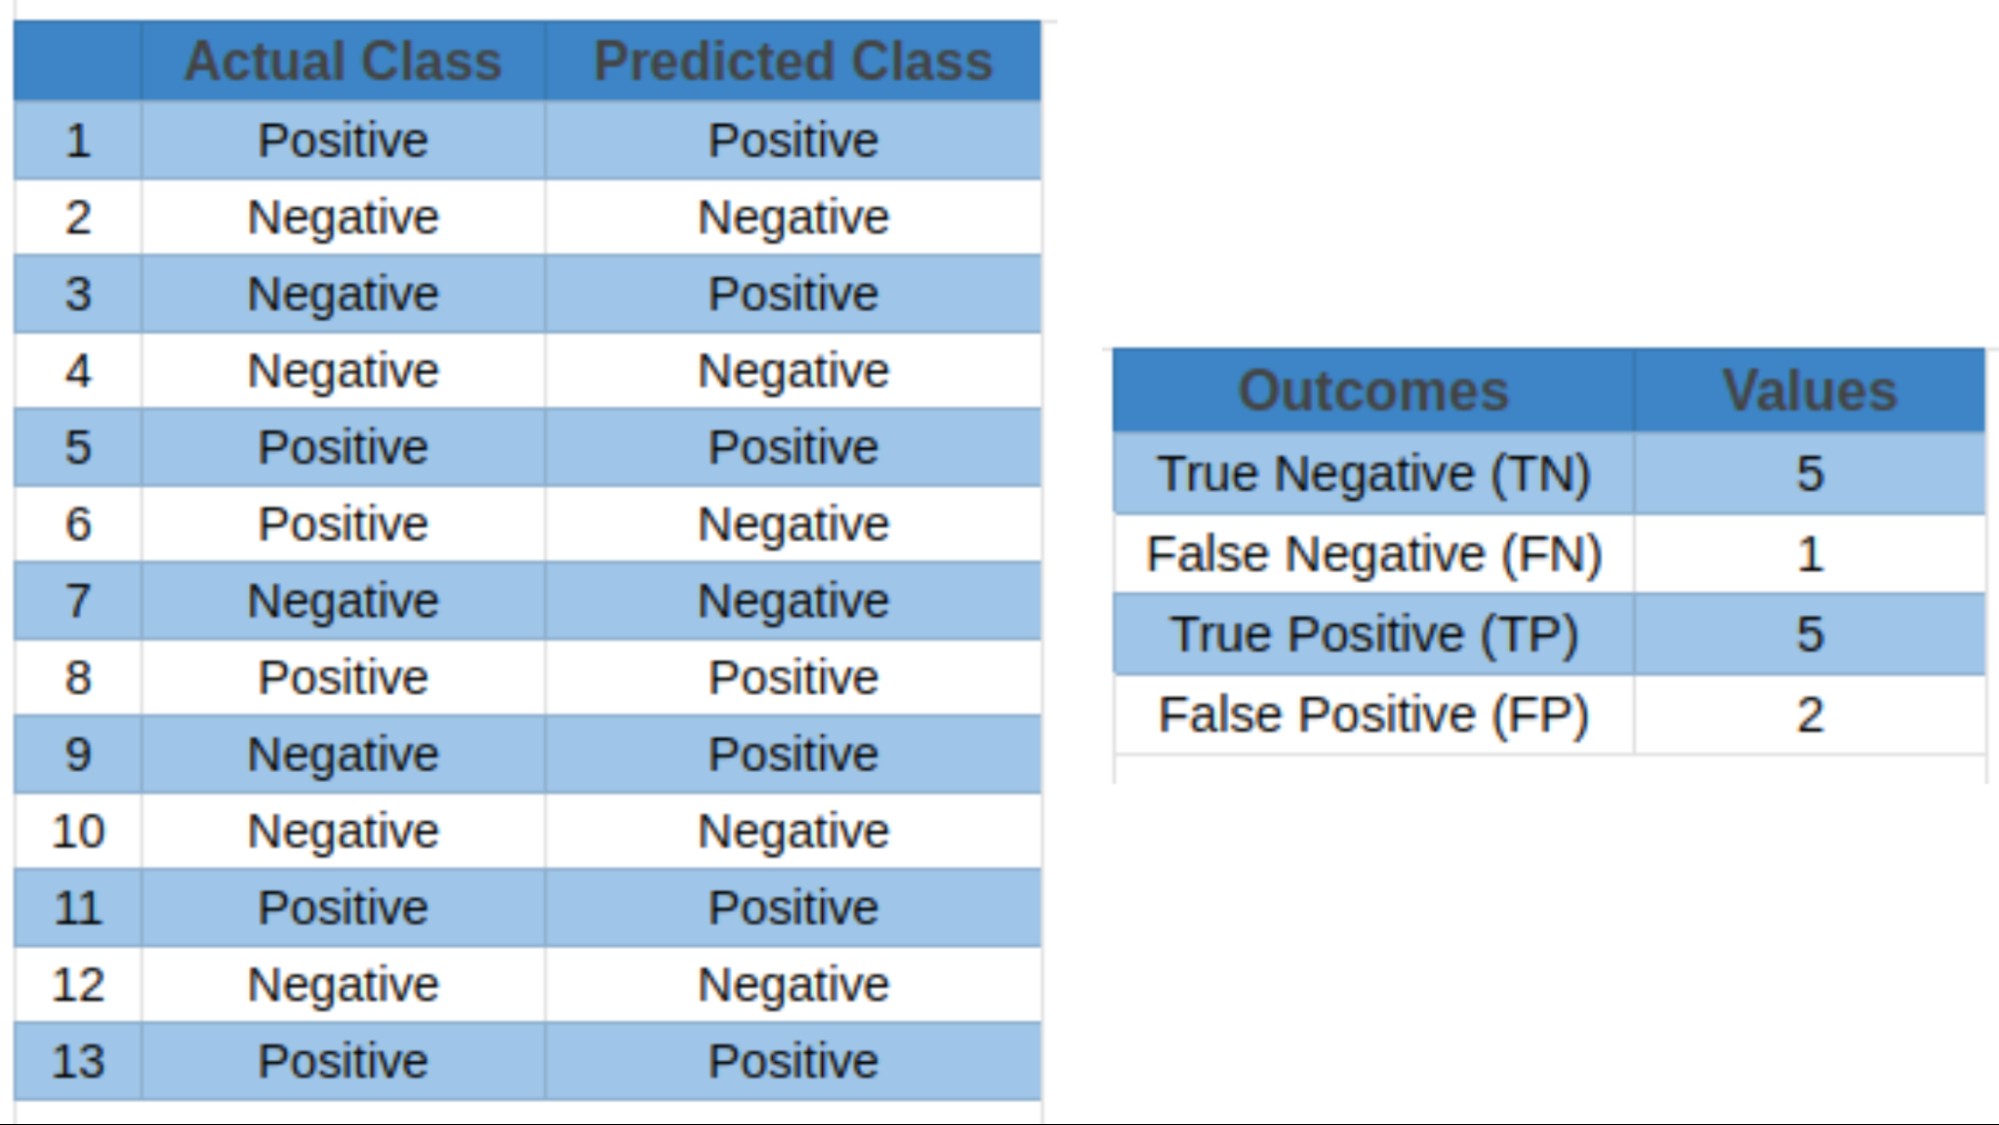
2.1 What Are the Potential Outcomes of Classification Predictions?
Classifiers have four potential outcomes:
- True Positives (TP): Correctly predicted positive events.
- True Negatives (TN): Accurately predicted negative events.
- False Positives (FP): Incorrectly predicted positive events when they were negative.
- False Negatives (FN): Incorrectly predicted negative events when they were positive.
Most classification metrics, including accuracy, precision, recall, specificity, F1 score, and AUC-ROC, use these outcomes to calculate their values.
Classification prediction outcomes
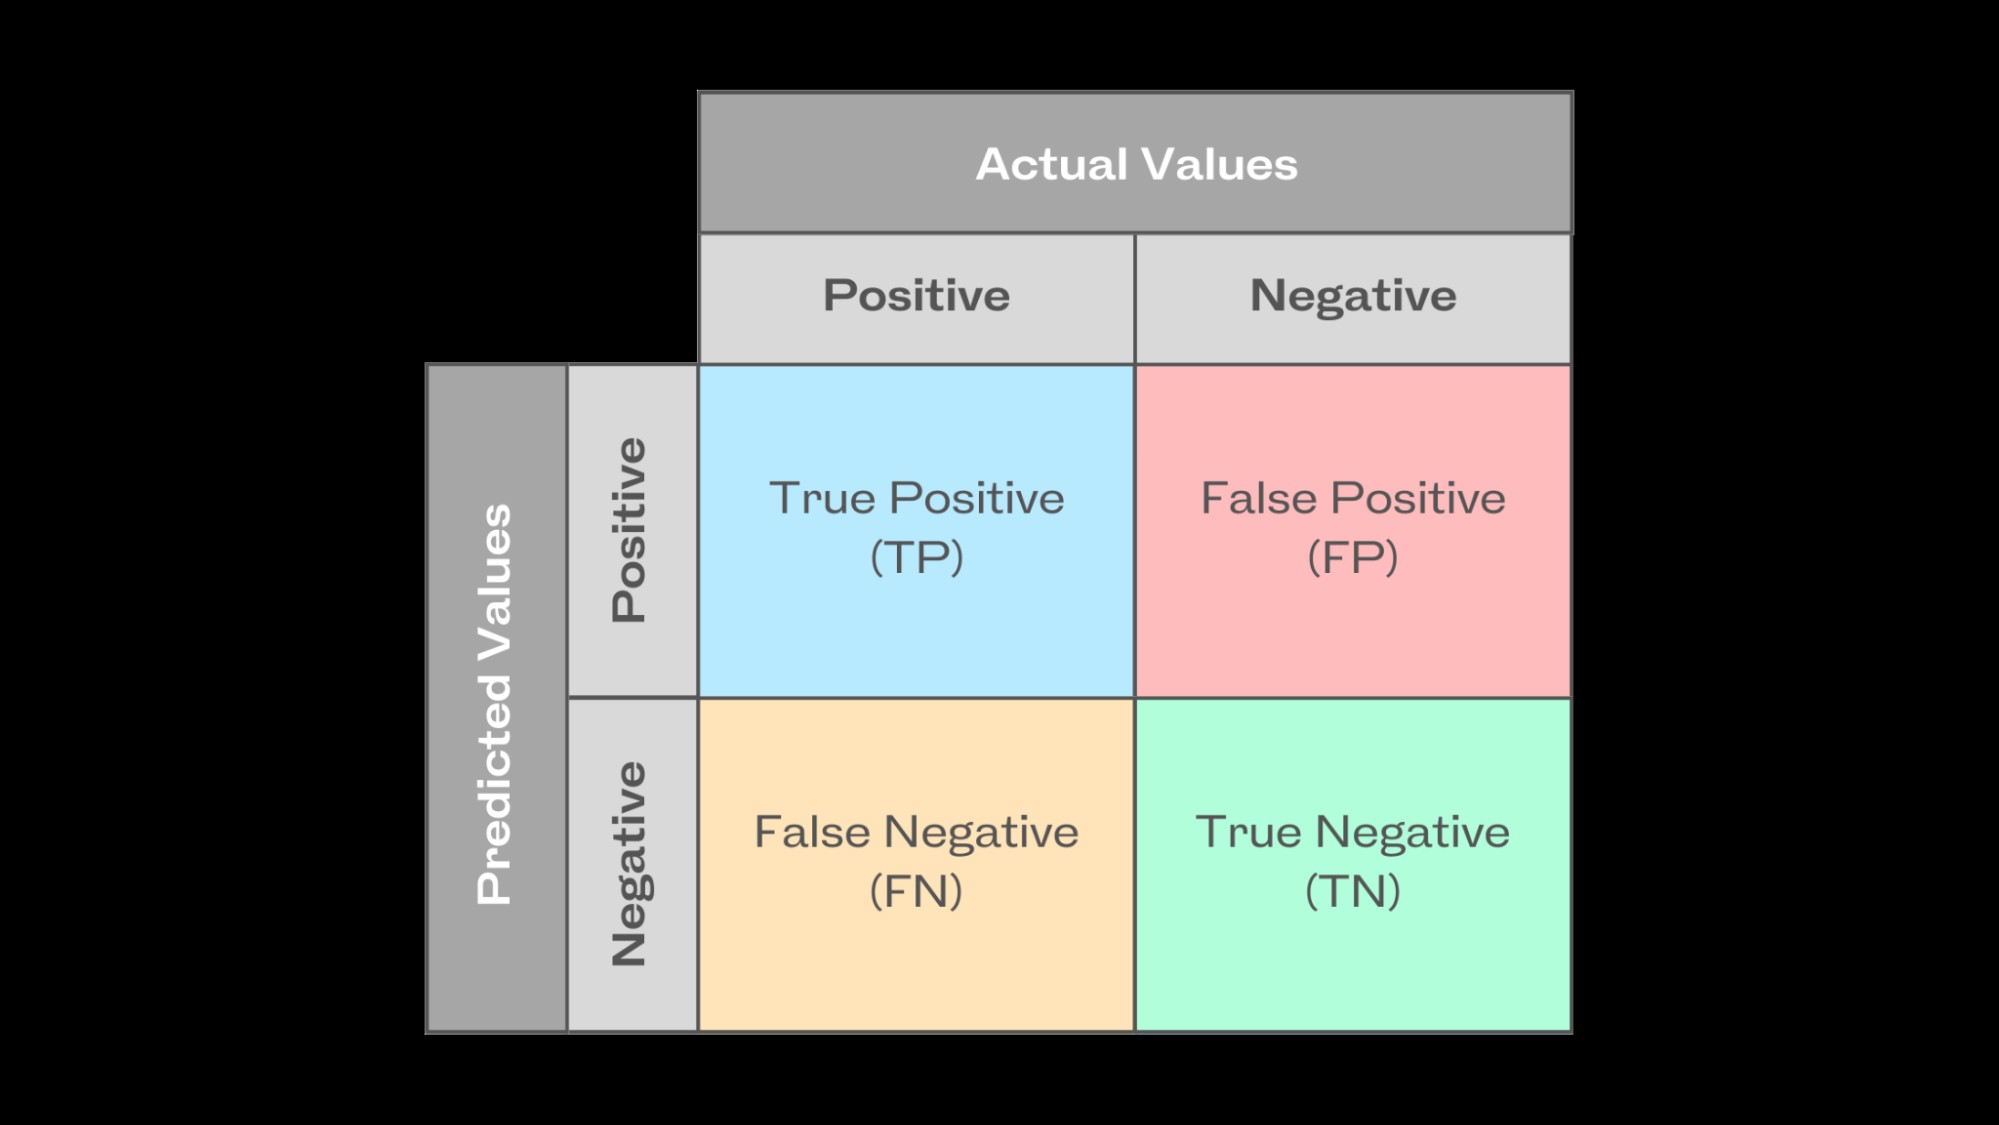
2.2 What Is a Confusion Matrix and How Is It Used?
A confusion matrix evaluates a classification model’s performance by mapping actual and predicted values. In binary classification, it is a table showing true positives, true negatives, false positives, and false negatives. This matrix summarizes prediction outcomes for calculating precision, recall, and the F1 score.
Confusion matrix illustration
2.3 How Do You Understand Accuracy, Precision, and Recall?
Understanding accuracy, precision, and recall is crucial for evaluating the performance of classification models. Each metric provides different insights into the model’s ability to correctly classify data points. Let’s delve into each of these metrics to grasp their significance and how they contribute to assessing model effectiveness.
2.3.1 Accuracy
Accuracy measures the overall correctness of predictions. It is calculated by dividing the number of correctly predicted events (both positive and negative) by the total number of events. The formula is:
Accuracy = (True Positives + True Negatives) / Total Events
Using the data from Table 1, the accuracy of a classification model can be calculated as:
Accuracy = (90 + 85) / 200 = 0.875
An accuracy score above 0.7 typically indicates average model performance, while a score above 0.9 suggests good performance. However, the relevance of the score depends on the specific task. Accuracy alone might not fully represent model performance, especially when class imbalance exists. Precision and recall metrics are used to address these limitations.
2.3.2 Precision
Precision assesses the quality of positive predictions by measuring their correctness. It is the number of true positive outcomes divided by the sum of true positive and false positive predictions. The formula is:
Precision = True Positives / (True Positives + False Positives)
Using the classification model outcomes from Table 1, precision is calculated as:
Precision = 90 / (90 + 10) = 0.90
Precision can be considered a quality metric; higher precision indicates that the algorithm provides more relevant results than irrelevant ones. It focuses solely on the correctness of positive predictions, without considering the correct detection of negative predictions.
2.3.3 Recall
Recall, also known as sensitivity, measures the model’s ability to correctly detect positive events. It is the percentage of accurately predicted positive events out of all actual positive events. The formula is:
Recall = True Positives / (True Positives + False Negatives)
Using the classification model outcomes from Table 1, recall is calculated as:
Recall = 90 / (90 + 15) = 0.857
A high recall score indicates that the classifier correctly predicts the majority of relevant results. However, the recall metric does not account for the potential repercussions of false positives. Ideally, classifiers should have both high precision and high recall, but this is not always possible. A classifier with high recall may have low precision, capturing most positive classes but producing many false positives. The F1 score is used to balance this precision-recall trade-off.
At LEARNS.EDU.VN, we provide comprehensive resources to help you master these concepts and apply them effectively in your machine learning projects. Enhance your understanding and improve your model performance with our expertly crafted educational materials.
3. What Is the F1 Score Metric?
The F1 score, or F-measure, is the harmonic mean of a classification model’s precision and recall. Both metrics contribute equally, ensuring the F1 metric accurately indicates model reliability.
Calculating the F1 score using the arithmetic mean can misrepresent overall performance, especially when precision and recall values vary significantly. The harmonic mean emphasizes the reciprocal of values, enhancing the impact of the smaller value to achieve a balanced measurement. This avoids overestimation caused by the arithmetic mean.
The F1 score formula is:
F1 Score = 2 (Precision Recall) / (Precision + Recall)
Using the classification model outcomes from Table 1, the F1 score is calculated as:
F1 Score = 2 (0.90 0.857) / (0.90 + 0.857) = 0.878
The harmonic mean balances precision and recall, ensuring neither is optimized at the expense of the other. The F1 score shows strong performance in recognizing positive cases while minimizing false positives and false negatives, making it suitable for imbalanced datasets.
F1 Score Metric
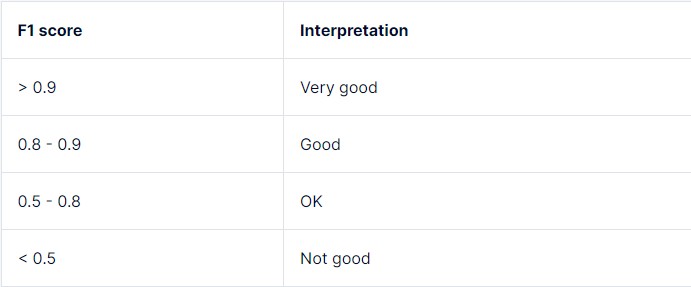
4. How Do You Interpret the F1 Score?
The F1 score ranges from 0 to 1, where 0 is the lowest and 1 is a perfect score, indicating accurate prediction of each label.
A high F1 score generally indicates balanced performance, with the model achieving high precision and high recall. A low F1 score often signifies a trade-off between recall and precision. The F1 score can be interpreted as follows:
| F1 Score Range | Interpretation |
|---|---|
| 0.0 – 0.2 | Very Poor |
| 0.2 – 0.4 | Poor |
| 0.4 – 0.6 | Average |
| 0.6 – 0.8 | Good |
| 0.8 – 1.0 | Excellent |

However, the threshold for what is considered “low” can change based on task requirements, model use case, and tolerance for mistakes. A simple decision tree classifier and a multi-layered deep learning neural network will have different ranges for high or low F1 scores.
LEARNS.EDU.VN offers courses and resources that delve deeper into interpreting and improving the F1 score for various machine learning models. Explore our materials to enhance your understanding and application of this critical metric.
Interpreting the F1 Score
5. What Are the ML Applications of the F1 Score?
The F1 score is crucial in applications where balancing precision and recall is essential for model evaluation.
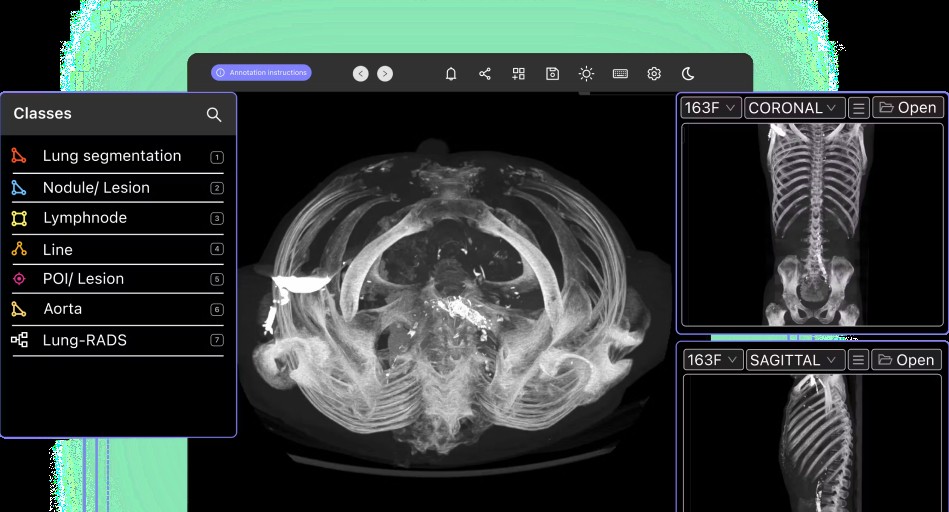
5.1 Medical Diagnostics
In medical diagnostics, high recall is important for correctly detecting positive occurrences, even at the cost of precision. A cancer detection classifier’s F1 score should minimize false negatives, ensuring patients with malignant cancer are not wrongly predicted as benign.
Medical Diagnostics
5.2 Sentiment Analysis
For NLP tasks like sentiment analysis, recognizing both positive and negative sentiments in textual data allows businesses to assess public opinion and brand sentiment. The F1 score efficiently evaluates sentiment analysis models by considering precision and recall when categorizing sentiments.
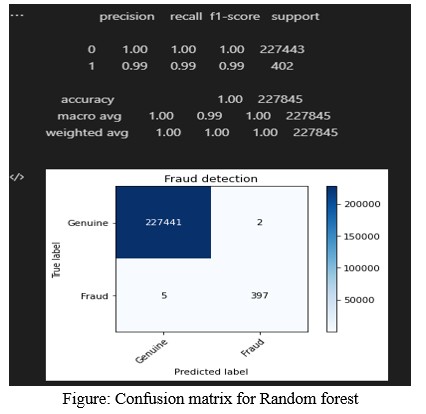
5.3 Fraud Detection
In fraud detection, the F1 score assesses models more accurately by considering precision (the accuracy of discovering fraudulent cases) and recall (the capacity to identify all instances of fraud). The figure below shows evaluation metrics for a credit card fraud detection model.
Fraud Detection
LEARNS.EDU.VN provides detailed case studies and practical examples illustrating the application of the F1 score in these and other machine learning domains. Discover how to leverage this metric for optimal model performance in real-world scenarios.
6. What Are the Limitations of the F1 Score?
ML practitioners must be aware of the limitations and caveats of the F1 score when interpreting its results.
6.1 Dataset Class Imbalance
With imbalanced data, where one class significantly outweighs the other, the F1 score might not give a true picture of model performance. It gives precision and recall equal weight, but achieving high precision or recall for the minority class may result in a lower F1 score due to the majority class’s influence.
6.2 Cost Associated with False Prediction Outcomes
False positives and false negatives can have diverse outcomes depending on the application. In medical diagnostics, a false negative is more dangerous than a false positive, requiring careful interpretation of the F1 score.
6.3 Contextual Dependence
The evaluation of the F1 score varies depending on the problem domain and task objectives. Different interpretations of what constitutes a high or low F1 score require different precision-recall criteria. A thorough understanding of the domain and the task is needed to use and interpret the F1 score properly.
LEARNS.EDU.VN offers advanced courses that cover strategies for handling these limitations and improving model evaluation in challenging scenarios. Learn how to use the F1 score effectively in diverse contexts with our comprehensive resources.
7. What Are the F-Score Variants?
To address severe class imbalance issues and achieve an appropriate balance between precision and recall, practitioners often use the following variants of the F-score metric:
7.1 F2 Score
This variant places more emphasis on recall than precision and is suitable for circumstances where detecting true positives is crucial. Recall is given more weight during the harmonic mean computation.
The F2 score formula is:
*F2 Score = 5 ((Precision Recall) / (4 Precision + Recall))**
7.2 F-beta Score
This variant offers a dynamic blend of recall and precision by changing the beta parameter, a weight coefficient greater than 0. The beta value can be adjusted based on task requirements; a beta greater than 1 favors recall.
The F-beta score is calculated using the same formula as the F2 score, with beta dictating the importance of recall against precision.
*Fβ Score = (1 + β²) ((Precision Recall) / (β² Precision + Recall))**
F-score Variants
8. How Can You Supplement the F1 Score?
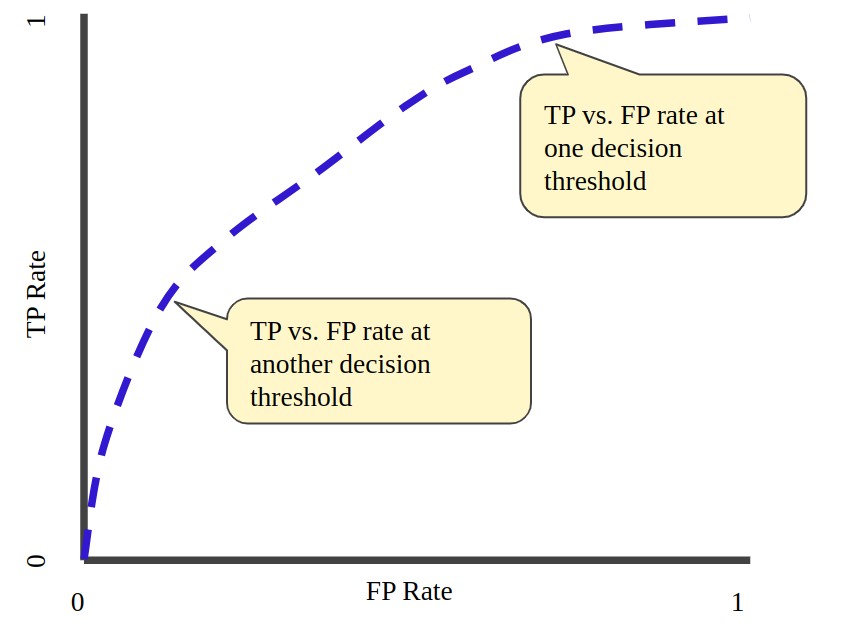
Other performance metrics, such as the Area Under the Curve-Receiver Operating Characteristic Curve (AUC-ROC), can supplement the F1 score to offer additional insights into AI model performance.
The AUC-ROC metric evaluates the model’s capability to differentiate between positive and negative classes across various classification criteria by plotting the true positive rate (TPR) versus the false positive rate (FPR).
Supplementing the F1 Score
LEARNS.EDU.VN provides resources that explain how to effectively combine the F1 score with other metrics like AUC-ROC to get a more complete picture of your model’s performance.
9. What Is the Future Research for the F1 Score?
As data science evolves, researchers continue to investigate challenges posed by imbalanced datasets. Modified F1 scores that account for class imbalance are being developed to improve performance evaluation.
Another important area of focus is fairness and ethics. The goal is to ensure metrics consider fairness towards specific subgroups or protected traits, in addition to overall performance.
Additionally, research proposes new discriminant metrics to gauge how well AI models maximize risk-adjusted returns for financial tasks, arguing that metrics like the F1 score were unsatisfactory for evaluation.
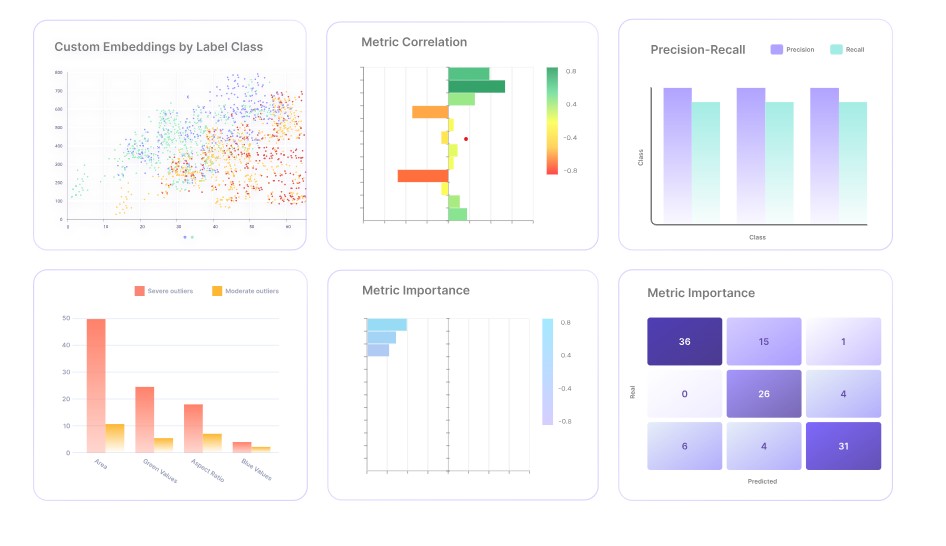
10. How Can Encord Active Help with Model Evaluation?
Encord Active is an ML platform that helps practitioners build better models by offering:
- Evaluation metrics visualization with intuitive charts and graphs.
- Auto-identification of labeling errors.
- Search and curation of high-value visual data using natural language search.
- Identification and fixing of bias, drift, and dataset errors.
- Detection of model failure modes with automated robustness tests.
- Comparison of datasets and models based on detailed metrics evaluation.
It provides a variety of evaluation approaches, including the F1 score, accuracy, precision, and recall. Encord Active’s simple user interface and easy-to-understand evaluation process enable data scientists to quickly evaluate machine learning models.
Model Evaluation with Encord Active
FAQ: What is a Good F1 Score in Machine Learning?
1. What does the F1 score measure in machine learning?
The F1 score measures a model’s accuracy by balancing precision and recall, providing a single metric to assess performance in classification tasks.
2. How is the F1 score calculated?
The F1 score is calculated as the harmonic mean of precision and recall, using the formula: F1 Score = 2 (Precision Recall) / (Precision + Recall).
3. What is considered a good F1 score?
An F1 score between 0.8 and 1.0 is generally considered excellent, indicating high precision and recall. A score between 0.6 and 0.8 is good, 0.4 and 0.6 is average, and below 0.4 is poor.
4. Why is the harmonic mean used in the F1 score instead of the arithmetic mean?
The harmonic mean is used because it gives more weight to low values, providing a more accurate representation of the model’s performance when precision and recall are imbalanced.
5. In what applications is the F1 score particularly useful?
The F1 score is particularly useful in medical diagnostics, sentiment analysis, and fraud detection, where balancing precision and recall is essential.
6. What are the limitations of using the F1 score?
The F1 score can be limited by dataset class imbalance, varying costs associated with false predictions, and contextual dependence on the problem domain and task objectives.
7. How does class imbalance affect the F1 score?
Class imbalance can skew the F1 score, as the metric may be influenced more by the majority class, potentially misrepresenting the model’s performance on the minority class.
8. What are the variants of the F1 score that address class imbalance?
Variants like the F2 score and F-beta score can be used to address class imbalance by placing more emphasis on recall or precision, depending on the specific needs of the application.
9. How can the F1 score be supplemented with other metrics for a more complete evaluation?
The F1 score can be supplemented with metrics like AUC-ROC, which provides additional insights into the model’s ability to differentiate between positive and negative classes across different thresholds.
10. What tools or platforms can help with model evaluation using the F1 score?
Platforms like Encord Active offer features such as evaluation metrics visualization, auto-identification of labeling errors, and tools for detecting bias and drift, helping practitioners build better models.Improving your understanding of machine learning metrics like the F1 score can significantly enhance your ability to build and evaluate effective models. At LEARNS.EDU.VN, we offer a wealth of resources to help you master these concepts and apply them in your projects.
Ready to take your machine learning skills to the next level? Visit LEARNS.EDU.VN today to explore our comprehensive courses and resources. Whether you’re looking to understand key metrics, enhance model performance, or explore advanced techniques, we have the tools and expertise to help you succeed. Contact us at 123 Education Way, Learnville, CA 90210, United States, or via WhatsApp at +1 555-555-1212. Let learns.edu.vn be your guide to mastering machine learning.