The term “learning curve” is widely used in everyday language to describe the initial difficulty encountered when acquiring a new skill. It suggests that learning is not always easy, especially at the beginning. While commonly used informally, the learning curve is also a robust theory utilized by learning and development (L&D) professionals to enhance knowledge retention and skill development strategies. This theory, often represented by a mathematical formula, provides a quantifiable method for organizations to gauge the time it takes to master a skill or task. You might also hear it referred to as the ‘experience curve’, ‘cost curve’, ‘efficiency curve’, or ‘productivity curve’, depending on the context.
This article delves into the learning curve theory, exploring its origins, advantages, disadvantages, various types, calculation methods, and its practical application in modern learning and development strategies.
Defining the Learning Curve
At its core, the learning curve illustrates the relationship between a learner’s proficiency in a task or activity and the amount of practice or time invested in that activity. It visually represents how performance changes as experience accumulates.
A visual representation of the learning curve formula, demonstrating the relationship between performance and practice over time.
General vs. Quantitative Learning Curves
The concept of the learning curve exists in both a broad, descriptive sense and a precise, mathematical application.
- Generalized Learning Curve: In its general sense, the learning curve is a colloquial expression describing the time and effort needed to overcome the initial challenges of learning something new. Think of learning to play a musical instrument, mastering a complex software, or becoming proficient in a new language. This is a qualitative way to describe the learning journey.
- Measured Learning Curve: Measured Learning Curves are more specific and involve a mathematical formula to quantify the rate of learning for a repeatable and measurable skill or task. This approach focuses on a single variable within a defined skill, task, or process to analyze improvements in efficiency or expertise over time. This allows for data-driven insights into training and performance.
A Brief History of the Learning Curve Theory
The foundation of the learning curve theory can be traced back to the late 19th century, evolving through various disciplines and research efforts. Here’s a historical overview:
Ebbinghaus Forgetting Curve (1885)
The earliest concept related to learning curves emerged from the work of Dr. Hermann Ebbinghaus in 1885. While studying memory, Ebbinghaus developed the forgetting curve theory. This theory investigated how information is retained or forgotten over time. Ebbinghaus’s work highlighted the natural decay of memory and the importance of reinforcement in learning, indirectly laying groundwork for understanding learning progression.
Experimental Psychology and Skill Acquisition (1934)
In 1934, Arthur Bills further explored the learning curve in his publication, General Experimental Psychology. Bills described the learning curve as a graphical tool to visualize improvements in efficiency rates for a given task through practice. He identified two primary types of learning curves: one showing increasing productivity with time and another showing decreasing time needed to perform a task, reflecting different patterns of skill acquisition.
Wright’s Experience Curve and the Modern Formula (1936)
T.P. Wright, in his 1936 paper Factors Affecting the Cost of Airplanes, developed the basis for the modern learning curve formula. Wright, studying airplane manufacturing costs, observed that the cost of building aircraft decreased as production volume and efficiency increased. He termed his model the “Cumulative Average Model” or “Wright’s Model”. This model, focused on cost reduction through experience, is the foundational formula for many learning curve variations used today.
Contemporary Applications in Learning and Development
The learning curve theory is based on the principle that initial investment in learning may outweigh immediate returns. However, as learners progress along the curve, the returns significantly surpass the initial investment.
The core idea is that consistent practice leads to improved task proficiency. This translates to reduced training costs and increased output over time. The learning curve model is valuable for tracking training progress, boosting productivity, and predicting learner performance and development over time within organizations.
The Learning Curve Formula Explained
The foundational learning curve formula, originally proposed by Wright, is: Y = aX^b
Let’s break down each component:
- Y = The average time required to perform the task per unit or batch.
- a = The time taken to complete the task the very first time.
- X = The total number of units produced or the number of times the task has been completed.
- b = The learning curve index or slope, representing the rate of improvement. This value is typically negative, indicating that time decreases as experience (X) increases.
This formula illustrates that as the number of attempts at a task (X) increases, the average time (Y) to complete that task decreases. The formula can be used to predict how quickly an individual or team can learn and improve at a given task.
It’s important to remember that the relationship between practice and performance is not always linear. Learning curves are characterized by periods of rapid improvement and plateaus, meaning that sometimes significant progress can be made with relatively little practice, while at other times, substantial effort may yield only marginal gains. This fluctuating relationship is what defines the shape and concept of the ‘learning curve’.
Exploring Different Types of Learning Curves
The shape and progression of a learning curve can vary depending on the nature of the task and the learning process. There are four common types of learning curve models:
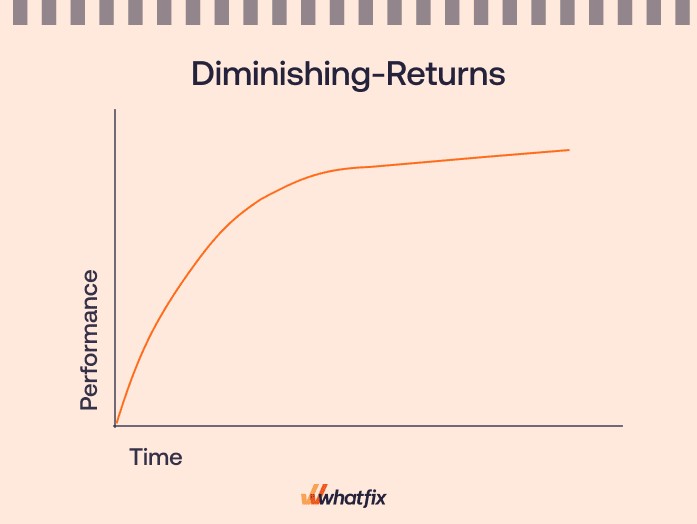
1. Diminishing Returns Learning Curve
In a diminishing returns learning curve, progress is rapid at the beginning of the learning process but gradually slows down over time. This pattern is typical for tasks that are relatively easy to learn initially or when skills are acquired quickly. Diminishing returns curves are straightforward to measure and predict performance changes in a workforce.
As learners approach mastery, the rate of improvement levels off, forming a plateau. This plateau can be due to reaching maximum efficiency in the task or the onset of fatigue, limiting further improvement in completion time.
2. Increasing Returns Learning Curve
The increasing returns learning curve shows slow initial progress, with the rate of improvement accelerating over time until proficiency is achieved. This curve is characteristic of tasks that are initially challenging to grasp and have a slower skill acquisition rate.
While the initial phase might seem costly due to slow learning, the investment pays off as learners enter a phase of high efficiency. However, if data suggests the task should be learned more quickly, an increasing returns curve might indicate a need to re-evaluate and refine employee training methods.
3. S-Curve Learning Curve
The S-curve model, also known as the increasing-decreasing returns learning curve, is perhaps the most commonly observed learning curve. It is particularly representative of learners who are completely new to a task.
Initially, progress is slow as learners grapple with the novelty of the task. As they gain experience, they enter a phase of rapid improvement, quickly reducing completion times and increasing proficiency. Eventually, performance plateaus as they reach a high level of skill. This plateau can indicate either maximum efficiency or the emergence of new challenges that hinder further progress.
4. Complex Learning Curve
The complex learning curve is designed to model more intricate learning patterns associated with mastering highly challenging tasks. It requires detailed tracking of progress due to its non-linear nature. This type of curve suggests that the task is difficult to learn and requires substantial practice before proficiency is attained.
The complex learning curve can be broken down into five stages:
- Stage 1: Initial Slow Learning: Characterized by slow progress at the beginning.
- Stage 2: Productivity Increase: Shows a phase of accelerated learning and increasing proficiency.
- Stage 3: Plateau: Indicates a leveling off in performance after reaching a certain level of mastery.
- Stage 4: Renewed Improvement: Represents a stage where the learner realizes there’s still room for improvement, leading to further performance gains.
- Stage 5: Overlearning: Also known as “automaticity,” where the skill becomes ingrained and performed almost without conscious effort, becoming muscle memory.
Complex learning curves are unique to each task, individual, or group. Learners often experience multiple peaks and plateaus when tackling tasks characterized by complex learning curves.
Advantages and Disadvantages of Utilizing the Learning Curve Model
The learning curve model provides valuable insights into various aspects of organizational performance, helping to identify areas for improvement, particularly in employee training and process efficiency. However, it’s important to acknowledge its limitations.
Let’s examine the key advantages and disadvantages:
Pros of the Learning Curve Model
- Cost Reduction Through Efficiency Gains: As employees or processes gain experience and efficiency, task completion times decrease, directly reducing labor costs. Furthermore, experience leads to better resource optimization and waste minimization, contributing to lower production costs overall.
- Enhanced Output Quality: Increased experience fosters a deeper understanding of tasks and processes. This enhanced knowledge and skill base leads to fewer errors and defects, resulting in higher quality products or services. The learning curve facilitates the refinement of techniques and processes, ultimately improving overall quality.
- Skill Development and Workforce Enhancement: The learning curve model underscores continuous improvement and a culture of learning. As employees become more skilled, they become more valuable assets to the organization. The model supports ongoing training and skill development, ensuring employees remain updated with the latest techniques and technologies in their respective fields.
- Predictable Performance Metrics for Planning: The learning curve model helps establish predictable patterns of performance improvement, allowing L&D leaders to measure training effectiveness over time. This predictability is crucial for strategic planning and forecasting. Organizations can leverage historical data to predict the time required for new employees to reach proficiency or for new processes to be fully implemented and optimized.
- Risk Mitigation Through Experience-Based Insights: Experience allows organizations to identify and mitigate potential risks and pitfalls. The learning curve enables the development of strategies and contingency plans based on past experiences. This accumulated knowledge aids in mitigating risks associated with new projects or process introductions, as the organization becomes more adept at anticipating and managing potential challenges.
Cons of the Learning Curve Model
- Limited Applicability in Highly Variable Environments: The learning curve model is most effective in environments characterized by repetitive and consistent tasks. In industries or roles involving highly variable tasks or demanding significant creative or adaptive work, the benefits of the learning curve may be less pronounced. For example, in artistic or research-driven fields, efficiency and productivity improvements over time may be less applicable than in manufacturing or routine service tasks.
- Oversimplification by Ignoring Multiple Variables: When applied to predict performance and skill acquisition for large groups, the learning curve model often simplifies reality by making assumptions about various complex variables. These variables can include learner motivation, sociological factors, workplace dynamics, the quality of L&D resources, and prior subject matter knowledge or task experience, all of which can significantly influence learning outcomes.
- Need for Further Analysis When Expected Results are Not Achieved: If a learning curve model fails to demonstrate anticipated results, such as task improvement over time, further analysis is necessary to identify and isolate other variables impacting learning outcomes. The model itself may not pinpoint the reasons for deviations from the expected learning progression.
Real-World Examples of the Learning Curve Theory in the Workplace
L&D teams can effectively use the learning curve model to estimate the time needed for individuals or teams to master new skills or processes. In many workplace applications, the learning curve reflects process improvement as much as individual learning.
1. Project Management Efficiency
In project management, teams become more efficient through repeated handling of similar tasks or projects. Initially, a project might take longer and require more resources due to unfamiliarity and unforeseen challenges. However, with experience, teams develop streamlined processes, enhance problem-solving skills, and gain a deeper understanding of project requirements. This accumulated experience leads to reduced time and cost in subsequent projects.
2. Manufacturing Cost Reduction
In manufacturing, the learning curve can track workforce performance and its impact on production costs. By substituting “performance” and “number of attempts” with “total production units” or “cost per unit,” organizations can analyze cost trends. As workers become more proficient, production output increases, and the per-unit cost decreases.
Organizations can predict this reduction in per-unit cost by modeling changes using the learning curve, factoring in labor costs and employee training investments. This analysis impacts product pricing strategies. Initially, a product might be priced higher due to higher per-unit production costs, but over time, as workforce efficiency improves, the per-unit cost decreases, potentially allowing for price adjustments.
3. Employee Training and Onboarding
When onboarding and training new employees, L&D teams are tasked with accelerating the time-to-proficiency for new hires. The learning curve model allows organizations to measure the time required to master different tasks and processes. This data enables business operations teams to forecast company growth more accurately and empowers employees to succeed in their new roles by setting realistic expectations for their learning journey.
4. Technology Adoption and Digital Transformation
Introducing new technology, such as a CRM or ERP system, within an organization typically involves multiple learning curves. Initially, employees may struggle with new systems, using software workflows incorrectly, leading to decreased productivity and potential internal resistance to change. Enterprise software, often complex and customized, presents a significant barrier to change management and a steep learning curve.
However, as employees become more familiar with the technology, their proficiency improves, leading to increased productivity, innovation, and often a competitive advantage. This progression is central to achieving digital adoption, where employees efficiently utilize technology to complete tasks, enabling organizations to realize the intended business outcomes of technology implementation and maximize their digital transformation ROI.
CASE STUDY: How REG Achieved 50% Reduction in CRM and ERP Time-to-Proficiency
REG’s L&D and IT departments faced challenges in training employees on their highly customized Salesforce CRM and JD Edwards ERP systems. New employees required up to six months to become proficient, leading to frequent account errors and incorrect process execution. Existing users struggled to adapt to new processes and adopt new features.
By implementing Whatfix, REG standardized end-user training with contextual in-app guidance integrated directly into the workflow. Whatfix enabled REG to reduce time-to-proficiency for their CRM and ERP systems by 50%, effectively shortening new employee onboarding by three months. Additionally, daily IT support tickets decreased by 600% due to in-app support resolving user issues proactively.
5. Healthcare and Medical Skill Development
In healthcare, the learning curve applies to various areas, including surgical procedures, diagnostic methods, and patient care techniques.
For example, surgeons may initially require more time to perform a new surgical procedure. However, as they repeat the procedure, their speed and efficiency improve, often leading to better patient outcomes. Similarly, healthcare professionals become more skilled in using new medical technologies or treatment protocols with experience.
The learning curve in healthcare is also accelerated through a “train-the-trainer” approach. As experienced surgeons and healthcare leaders master procedures and skills, they can train instructors to identify resources, learning methods, assistance types, and potential friction points in the learning process for others.
Strategies to Accelerate the Learning Curve
L&D teams and educators can employ various strategies to accelerate the learning curve. Here are eight best practices to help flatten the curve and enhance learning efficiency:
1. Clearly Define Output Metrics
Establish both short-term and long-term measurable outcomes to evaluate employee performance, training effectiveness, and task mastery. Clearly define the objectives of your training programs, specifying what employees should achieve upon completion.
2. Implement Efficient Onboarding Processes
Create a robust and efficient onboarding process to help new hires quickly gain competence and confidence in their roles. A strong onboarding process provides new team members with the necessary information, training, and tools during their initial weeks, making their learning curve more productive and significantly shorter in the long run.
3. Personalize Training Programs
Develop personalized learning programs with training content tailored to individual job roles and learning styles. Personalized learning enhances employee engagement, improves training effectiveness, accelerates time-to-proficiency, and ultimately flattens the learning curve.
4. Utilize Data-Driven Decision Making
If learning curve data indicates that current training processes are ineffective, explore alternative employee training methods and implement necessary modifications to optimize training programs. Finding the right adjustments to improve performance may require iterative experimentation and refinement.
5. Incorporate Mentorship and Coaching
Even the most well-structured formal training programs may not impart all the practical knowledge and nuances employees need to perform effectively. Real-life coaching from experienced professionals—supervisors, mentors, or veteran employees—can provide invaluable just-in-time knowledge transfer and practical guidance.
6. Invest in Training Technology Solutions
Increasingly, organizations are leveraging employee training software to deliver effective training with personalized learning content. These platforms often use user analytics to identify learning patterns and help shorten the learning curve across the workforce.
Various types of employee training software are available to support the creation and management of comprehensive employee training programs.
7. Establish Clear Timeframes for Skill Acquisition
To shorten the learning curve, set clear timeframes for achieving desired learning outcomes. This allows for assessing whether training methods are delivering expected results. For example, define that new hires should be able to manage leads and accounts in the company CRM after completing a 3-week CRM training program.
8. Implement Continuous Monitoring of Learning Progress
The learning curve theory should not be applied solely during periods of change or when training challenges arise. Instead, continuously monitor learning curves year-round. Continuous monitoring helps identify emerging issues early, allowing for timely adjustments and modifications to training approaches as needed.
Learning Becomes Easier with Digital Adoption Platforms
A digital adoption platform (DAP) like Whatfix DAP empowers organizations to help employees overcome steep learning curves associated with complex software applications and digital processes. This is achieved through role-based in-app guidance and real-time support directly within the applications employees use daily.
With a DAP, organizations can equip their employees with tools and features such as:
- Sandbox Application Environments (Whatfix Mirror): Provide simulated, hands-on training environments without the risk of affecting live software data using Whatfix Mirror.
- In-App Guided Flows: Step-by-step walkthroughs that guide employees through complex workflows, new processes, and infrequent tasks directly within the application.
- Onboarding Tours and Task Lists: Interactive guides that accelerate employee time-to-proficiency on essential tasks and software functionalities.
- Contextual Smart Tips: Informative prompts that provide additional information and guide end-users to take specific actions within the application interface.
- Pop-Ups and Beacons: Alerts and notifications that inform end-users about new updates, process changes, new features, or important team announcements.
- Field Validation: Real-time data validation to ensure accurate data entry in the correct format, improving data quality and process compliance.
- Self-Help Support: Instant access to performance support and troubleshooting resources directly within the application, enabling employees to resolve issues independently.
- Guidance Analytics: Data-driven insights that track employee engagement with in-app guidance and support, providing metrics on Task List completion, Smart Tip effectiveness on key metrics like time-to-completion, and popular Self-Help queries.
Ready to transform your employee learning experience? Request a Whatfix demo today!