Machine learning, a dynamic field within computer science, empowers computers to learn from data without explicit programming. At its core, machine learning branches into several types, with Supervised And Unsupervised Learning standing out as the foundational pillars. Understanding these two approaches is crucial for anyone venturing into the world of data science and artificial intelligence. This article provides an in-depth exploration of supervised and unsupervised learning, their methodologies, applications, advantages, and disadvantages, offering a comprehensive guide for learners and practitioners alike.
What is Supervised Learning?
Supervised learning is a machine learning paradigm where algorithms learn from labeled data. Labeled data means that each data point is tagged with the correct answer or classification, acting as a “supervisor” to guide the learning process. Imagine teaching a child to identify fruits. You show them an apple and say, “This is an apple,” then a banana, “This is a banana,” and so on. In supervised learning, the algorithm plays the role of the child, and the labeled data acts as the teacher. The goal is for the algorithm to learn the mapping between inputs (the features of the data) and outputs (the labels) so that it can predict the output for new, unseen data.
For example, if you want to train a machine to recognize cats in images, you would provide it with a dataset of images labeled as either “cat” or “not cat.” The supervised learning algorithm analyzes these images and their corresponding labels to learn the characteristics that define a cat. Once trained, the model can then classify new images as containing a cat or not.
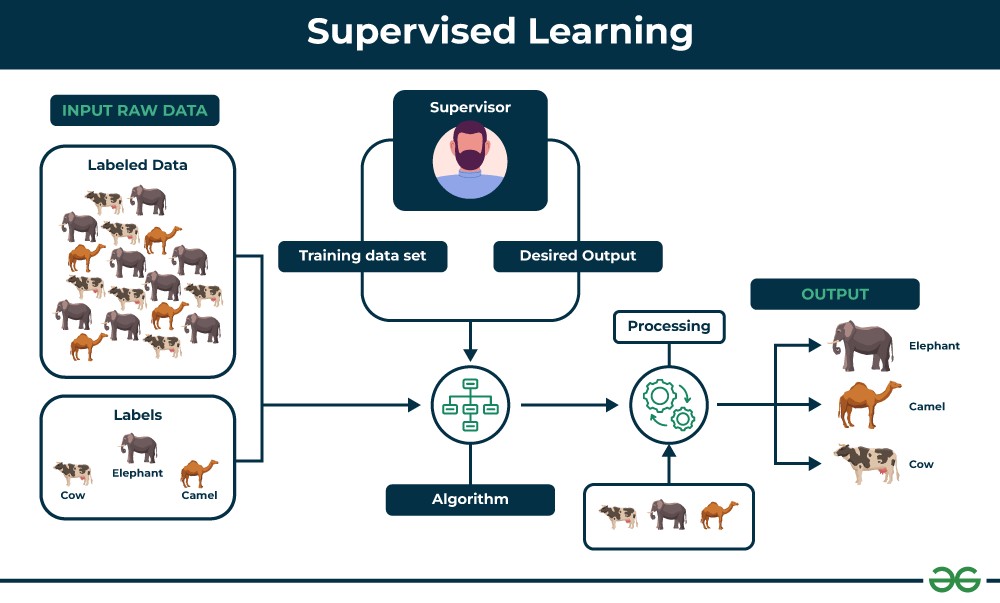 Supervised learning process illustrated with fruit identification.
Alt text: Diagram illustrating supervised learning with fruit images as input and fruit labels (Apple, Banana, Orange) as output, demonstrating the concept of learning from labeled data.
Key Characteristics of Supervised Learning:
- Labeled Data: Requires datasets where each input is paired with a correct output label.
- Training Phase: The algorithm learns from this labeled data to identify patterns and relationships.
- Prediction: The trained model is used to predict outputs for new, unlabeled input data.
- Goal-Oriented: Aims to learn a specific mapping function to predict a defined target variable.
Illustrative Example:
Consider a fruit basket identification task. To train a supervised learning model:
-
Data Labeling: You would label images of fruits. For instance:
- Round, red fruit with a top depression labeled as “Apple.”
- Long, curved, yellow fruit labeled as “Banana.”
-
Training: The algorithm learns from this labeled data, associating features like shape and color with fruit names.
-
Prediction: When presented with a new fruit, say a banana, the trained model analyzes its features (shape, color) and, based on its learned knowledge, correctly identifies it as a “Banana.”
This example highlights how supervised learning enables machines to learn from experience and apply that learning to new situations, much like humans do.
Types of Supervised Learning Algorithms
Supervised learning algorithms are broadly categorized into two main types based on the type of output they predict:
1. Regression
Regression algorithms are used to predict continuous numerical values. Think of predicting house prices, stock market trends, or temperature forecasts. In regression, the output variable is a real value, and the algorithm aims to establish a relationship between input features and this continuous output.
Common Regression Algorithms:
- Linear Regression: Models the relationship between variables using a straight line.
- Polynomial Regression: Uses polynomial equations to model non-linear relationships.
- Support Vector Regression (SVR): Applies Support Vector Machine principles for regression tasks.
- Decision Tree Regression: Uses a tree-like structure to make decisions and predict values.
- Random Forest Regression: An ensemble method that combines multiple decision trees for improved accuracy and robustness.
2. Classification
Classification algorithms are used to predict categorical values, essentially assigning data points to predefined categories or classes. Examples include classifying emails as “spam” or “not spam,” identifying images as “cat,” “dog,” or “bird,” or diagnosing a disease as “present” or “absent.” The output in classification is discrete, belonging to a finite set of classes.
Common Classification Algorithms:
- Logistic Regression: Despite its name, it’s a classification algorithm used for binary classification problems.
- Support Vector Machines (SVM): Effective for both linear and non-linear classification using hyperplanes.
- Decision Trees: Tree-like structures used for making classification decisions based on features.
- Random Forests: Ensemble of decision trees for improved classification performance and generalization.
- Naive Bayes: Based on Bayes’ theorem, particularly useful for text classification and spam filtering.
Evaluating Supervised Learning Models
Evaluating the performance of supervised learning models is crucial to ensure they are accurate and reliable. Different evaluation metrics are used for regression and classification tasks.
Evaluation Metrics for Regression
- Mean Squared Error (MSE): Calculates the average of the squared differences between predicted and actual values. Lower MSE indicates better performance.
- Root Mean Squared Error (RMSE): The square root of MSE, providing a more interpretable measure of prediction error in the original units of the target variable. Lower RMSE is better.
- Mean Absolute Error (MAE): Measures the average absolute difference between predicted and actual values. Less sensitive to outliers than MSE and RMSE. Lower MAE is better.
- R-squared (Coefficient of Determination): Represents the proportion of variance in the target variable explained by the model. Higher R-squared values (closer to 1) indicate a better fit.
Evaluation Metrics for Classification
- Accuracy: The percentage of correctly classified instances out of the total instances. Higher accuracy is generally better, but can be misleading with imbalanced datasets.
- Precision: Out of all instances predicted as positive, the percentage that are actually positive. High precision minimizes false positives.
- Recall (Sensitivity): Out of all actual positive instances, the percentage correctly identified as positive. High recall minimizes false negatives.
- F1-Score: The harmonic mean of precision and recall, providing a balanced measure of a classifier’s performance, especially useful in imbalanced datasets.
- Confusion Matrix: A table summarizing the performance of a classification model, showing counts of true positives, true negatives, false positives, and false negatives for each class. It provides a detailed view of classification accuracy by class.
Applications of Supervised Learning
Supervised learning is widely applied across various domains, solving real-world problems effectively:
- Spam Filtering: Classifying emails as spam or not spam based on email content and features.
- Image Classification: Categorizing images into different classes (e.g., animals, objects, scenes) for image search, content moderation, and recommendation systems.
- Medical Diagnosis: Analyzing patient data (medical images, test results) to detect diseases or conditions, assisting in early and accurate diagnoses.
- Fraud Detection: Identifying fraudulent transactions in financial data by recognizing patterns indicative of malicious activity.
- Natural Language Processing (NLP): Enabling machines to understand and process human language for sentiment analysis, machine translation, and text summarization.
- Customer Churn Prediction: Predicting which customers are likely to stop using a service, allowing businesses to take proactive retention measures.
Advantages of Supervised Learning
- Leverages Labeled Data: Effectively utilizes labeled data to learn precise mappings and make accurate predictions.
- Performance Optimization: Algorithms can be optimized for specific performance metrics (accuracy, precision, recall) based on the task.
- Solves Real-World Problems: Applicable to a wide range of practical problems in various industries.
- Classification and Regression Tasks: Versatile for both categorical and continuous output predictions.
- Controlled Learning: Provides control over the classes or target variables based on the labeled data provided.
Disadvantages of Supervised Learning
- Labeled Data Dependency: Requires high-quality, labeled data, which can be expensive, time-consuming, or difficult to obtain.
- Computational Cost: Training on large, labeled datasets can be computationally intensive and time-consuming.
- Complexity Handling: May struggle with highly complex tasks or datasets where labels are ambiguous or noisy.
- Generalization Limitations: Performance heavily depends on the representativeness of the training data; models might not generalize well to significantly different data.
- Not Suitable for Unlabeled Data Exploration: Ineffective when the goal is to discover hidden patterns in unlabeled data without pre-defined categories.
What is Unsupervised Learning?
Unsupervised learning is a type of machine learning that deals with unlabeled data. In contrast to supervised learning, there’s no “teacher” or pre-defined correct answer. Instead, the algorithm is left to its own devices to explore the data and discover inherent patterns, structures, and relationships without any explicit guidance. The machine must find hidden structures in unlabeled data by itself.
Imagine giving a child a box of mixed toys they’ve never seen before and asking them to organize them. They might group toys by color, shape, size, or function, discovering patterns on their own without any prior instructions. Unsupervised learning algorithms operate similarly, identifying groupings and associations in data based on similarities and differences.
For example, in customer segmentation, an unsupervised learning algorithm can analyze customer purchase history and identify distinct groups of customers based on their buying behavior, even without pre-existing labels defining customer segments.
Alt text: Diagram illustrating unsupervised learning with unlabeled images of cats and dogs as input, resulting in two clusters, demonstrating the concept of finding patterns in unlabeled data.
Key Characteristics of Unsupervised Learning:
- Unlabeled Data: Works with datasets lacking pre-defined labels or categories.
- Pattern Discovery: Aims to find hidden structures, patterns, and relationships within the data.
- No Supervision: Algorithms operate without explicit guidance or correct answers.
- Exploratory Nature: Often used for exploratory data analysis and gaining insights from data.
- Data-Driven Grouping: Groups similar data points together based on inherent characteristics.
Illustrative Example:
Consider analyzing a dataset of animal images without labels. An unsupervised learning algorithm can:
- Pattern Recognition: Analyze features like shape, size, fur texture, etc., in the images.
- Clustering: Group images based on similarities. For instance, images of cats might be grouped together, and images of dogs might form another group, even without the algorithm “knowing” what cats or dogs are beforehand.
- Insight Generation: Reveal inherent groupings in the data, potentially corresponding to different animal species, without relying on pre-existing labels.
This example demonstrates how unsupervised learning empowers machines to autonomously discover hidden information and structures from raw, unlabeled data.
Types of Unsupervised Learning Algorithms
Unsupervised learning algorithms are primarily categorized into two main types:
1. Clustering
Clustering algorithms aim to group similar data points together into clusters based on their intrinsic characteristics. The goal is to partition the data into meaningful subgroups where data points within a cluster are more similar to each other than to those in other clusters. Clustering is used for tasks like customer segmentation, document categorization, and anomaly detection.
Common Clustering Types and Algorithms:
- Partitioning Clustering (e.g., K-Means): Divides data into non-overlapping clusters. K-Means is a popular algorithm that iteratively assigns data points to the nearest cluster center and updates cluster centers.
- Hierarchical Clustering: Creates a hierarchy of clusters, either by agglomerative (bottom-up) or divisive (top-down) approaches.
- Density-Based Clustering (e.g., DBSCAN): Identifies clusters as dense regions separated by sparser regions. DBSCAN is effective in finding clusters of arbitrary shapes and handling noise.
- Distribution-Based Clustering (e.g., Gaussian Mixture Models – GMMs): Assumes data points are generated from a mixture of probability distributions (e.g., Gaussian distributions) and assigns data points to clusters based on probabilities.
2. Association Rule Learning
Association rule learning aims to discover interesting relationships or associations between variables in large datasets. It seeks to identify rules that describe frequent co-occurrence patterns, often expressed in the form of “if-then” rules. Association rule learning is commonly used in market basket analysis to understand customer purchasing behavior and in recommendation systems.
Common Association Rule Learning Algorithms:
- Apriori Algorithm: A foundational algorithm that finds frequent itemsets in a dataset and generates association rules.
- Eclat Algorithm: An efficient algorithm for frequent itemset mining using vertical data format.
- FP-Growth Algorithm: Another efficient algorithm for frequent itemset mining that uses a tree-based data structure (FP-tree).
Evaluating Unsupervised Learning Models
Evaluating unsupervised learning models is more challenging than supervised models because there are no ground truth labels to compare against. Evaluation often relies on intrinsic metrics that assess the quality of the discovered structures or clusters.
Common Evaluation Metrics for Unsupervised Learning:
- Silhouette Score: Measures how well each data point is clustered, considering both cluster cohesion (how close points are to their own cluster) and separation (how far points are from other clusters). Ranges from -1 to 1, with higher scores indicating better clustering.
- Calinski-Harabasz Score (Variance Ratio Criterion): Measures the ratio of between-cluster variance to within-cluster variance. Higher scores generally indicate better-defined clusters.
- Davies-Bouldin Index: Measures the average similarity between each cluster and its most similar cluster. Lower scores indicate better clustering, with clusters being well-separated and compact.
- Adjusted Rand Index (ARI): Measures the similarity between two clusterings, often used when ground truth labels are partially available or for comparing different clustering results. Ranges from -1 to 1, with higher scores indicating more similar clusterings.
- F1-Score (for Clustering): Can be adapted for evaluating clustering performance by treating clusters as predicted classes and using ground truth labels (if available) as actual classes.
Applications of Unsupervised Learning
Unsupervised learning is invaluable in numerous applications where data is unlabeled or when the goal is exploratory data analysis:
- Anomaly Detection: Identifying unusual data points or patterns that deviate from normal behavior, crucial for fraud detection, network intrusion detection, and equipment failure prediction.
- Customer Segmentation: Grouping customers based on purchasing behavior, demographics, or other characteristics for targeted marketing and personalized services.
- Recommendation Systems: Discovering user preferences and recommending products, movies, or music based on patterns in user behavior.
- Dimensionality Reduction: Reducing the number of variables in a dataset while preserving essential information, useful for data visualization and feature extraction.
- Image Analysis and Computer Vision: Grouping images based on content, object detection without labeled examples, and image retrieval.
- Scientific Discovery: Uncovering hidden patterns and relationships in scientific data, leading to new hypotheses and insights in fields like biology, astronomy, and social sciences.
Advantages of Unsupervised Learning
- Works with Unlabeled Data: Eliminates the need for expensive and time-consuming data labeling.
- Pattern Discovery: Excels at finding previously unknown patterns and structures in data, leading to new insights.
- Dimensionality Reduction: Effective for reducing data complexity and extracting key features.
- Exploratory Data Analysis: Ideal for exploring data, understanding its inherent structure, and generating hypotheses.
- Versatility: Applicable to a wide range of problems where data is naturally unlabeled or where the goal is pattern discovery.
Disadvantages of Unsupervised Learning
- Evaluation Challenges: Quantifying the accuracy and effectiveness can be difficult due to the lack of ground truth labels.
- Lower Accuracy Compared to Supervised Learning: Results may be less precise compared to supervised learning when specific prediction tasks are involved.
- Interpretation Complexity: Requires human expertise to interpret the discovered patterns and clusters and assign meaningful labels post-analysis.
- Sensitivity to Data Quality: Performance can be significantly affected by noisy data, outliers, and missing values.
- Limited Control: Less control over the learning process and the specific types of patterns discovered compared to supervised learning.
Supervised vs. Unsupervised Machine Learning: Key Differences
| Feature | Supervised Machine Learning | Unsupervised Machine Learning |
|---|---|---|
| Input Data | Labeled data | Unlabeled data |
| Computational Complexity | Generally simpler | Computationally more complex |
| Accuracy | Typically higher accuracy for prediction tasks | Generally lower accuracy for prediction tasks |
| Number of Classes | Number of classes is known or pre-defined | Number of classes is often unknown |
| Data Analysis | Offline analysis | Real-time analysis of data possible |
| Algorithms | Linear Regression, Logistic Regression, SVM, Decision Trees, Random Forests, Neural Networks | K-Means, Hierarchical Clustering, DBSCAN, Apriori, PCA |
| Output | Desired output is specified in labels | Desired output is pattern discovery |
| Training Data Usage | Uses training data to learn a model | No explicit training data in the same sense |
| Model Complexity | Can learn complex models but may require more labeled data | Can learn complex models from unlabeled data |
| Model Testing | Model performance can be directly tested | Model evaluation is more subjective |
| Commonly Called | Classification and Regression | Clustering and Association Analysis |
| Example | Image classification (e.g., cat vs. dog) | Customer segmentation |
| Supervision | Requires supervision (labeled data) | No supervision required (unlabeled data) |
Conclusion
Both supervised and unsupervised learning are essential components of the machine learning toolkit. Supervised learning excels when we have labeled data and a clear target variable to predict, making it suitable for tasks like classification and regression. Unsupervised learning shines when dealing with unlabeled data and the goal is to discover hidden patterns, structures, or groupings, proving invaluable for exploratory data analysis, anomaly detection, and customer segmentation. Choosing between them depends fundamentally on the nature of the data available and the specific problem we aim to solve. Often, a combination of both approaches can lead to even more powerful and insightful results.
Frequently Asked Questions (FAQs)
1. What is the fundamental difference between supervised and unsupervised machine learning?
The core difference lies in the type of data they use. Supervised learning uses labeled data to learn a mapping from inputs to outputs, enabling predictions. Unsupervised learning uses unlabeled data to discover hidden patterns and structures without pre-defined outputs.
2. When should I use supervised learning?
Use supervised learning when you have labeled data and want to predict a specific outcome or classify data into known categories. Common use cases include classification (spam detection, image recognition) and regression (predicting house prices, stock prices).
3. What are some common supervised learning algorithms?
Common supervised learning algorithms include:
- Classification: Logistic Regression, Support Vector Machines (SVM), Decision Trees, Random Forests, Naive Bayes, K-Nearest Neighbors (KNN).
- Regression: Linear Regression, Polynomial Regression, Support Vector Regression (SVR), Decision Tree Regression, Random Forest Regression.
4. When is unsupervised learning the right choice?
Opt for unsupervised learning when you have unlabeled data and want to explore the data’s structure, find patterns, or group similar data points. It is ideal for tasks like clustering (customer segmentation), dimensionality reduction (PCA), and anomaly detection.
5. Could you list some popular unsupervised learning algorithms?
Popular unsupervised learning algorithms include:
- Clustering: K-Means, Hierarchical Clustering, DBSCAN, Gaussian Mixture Models (GMMs).
- Dimensionality Reduction: Principal Component Analysis (PCA), t-distributed Stochastic Neighbor Embedding (t-SNE), Autoencoders.
- Association Rule Learning: Apriori Algorithm, Eclat Algorithm, FP-Growth Algorithm.
6. Can supervised and unsupervised learning be combined?
Yes, absolutely! It’s common to combine them. For example, you might use unsupervised learning for feature extraction or dimensionality reduction on unlabeled data, and then use supervised learning on labeled data with these new features for prediction or classification. Semi-supervised learning is another approach that leverages both labeled and unlabeled data in the learning process.
Next Article Placeholder Further Reading on Machine Learning