Machine learning (ML) is revolutionizing numerous fields by enabling computers to learn from data without explicit programming. Within machine learning, two primary approaches stand out: supervised learning and unsupervised learning. These methods differ fundamentally in how they learn from data and the types of problems they solve. Understanding the nuances of Supervised Vs Unsupervised Learning is crucial for anyone venturing into the world of data science and artificial intelligence.
In supervised learning, algorithms are trained on labeled datasets, where input data is paired with corresponding desired outputs. This “supervision” allows the model to learn a mapping function that can predict outputs for new, unseen inputs. Supervised learning excels in tasks like classification, regression, and object detection, where the goal is to predict a specific outcome based on known examples.
Conversely, unsupervised learning operates on unlabeled data, where algorithms must discern patterns and structures without explicit guidance. The machine’s task is to explore the data and identify inherent relationships, clusters, or anomalies. Unsupervised learning is particularly effective for tasks such as clustering, dimensionality reduction, and anomaly detection, where the objective is to uncover hidden insights from data.
What is Supervised Learning?
Supervised learning is a type of machine learning algorithm that learns from labeled data. Labeled data means that each data point is tagged with the correct answer or classification, acting like a supervisor guiding the learning process.
Imagine a teacher instructing a student. In supervised learning, the “teacher” is the labeled dataset, which provides the algorithm with examples of inputs and their corresponding correct outputs. The algorithm analyzes this training data to learn the underlying relationship between inputs and outputs. Once trained, the model can take new, unlabeled data and predict the output based on the patterns it has learned.
For example, consider training a model to identify different types of fruits. A labeled dataset would consist of images of fruits, with each image labeled as “apple,” “banana,” or “orange.”
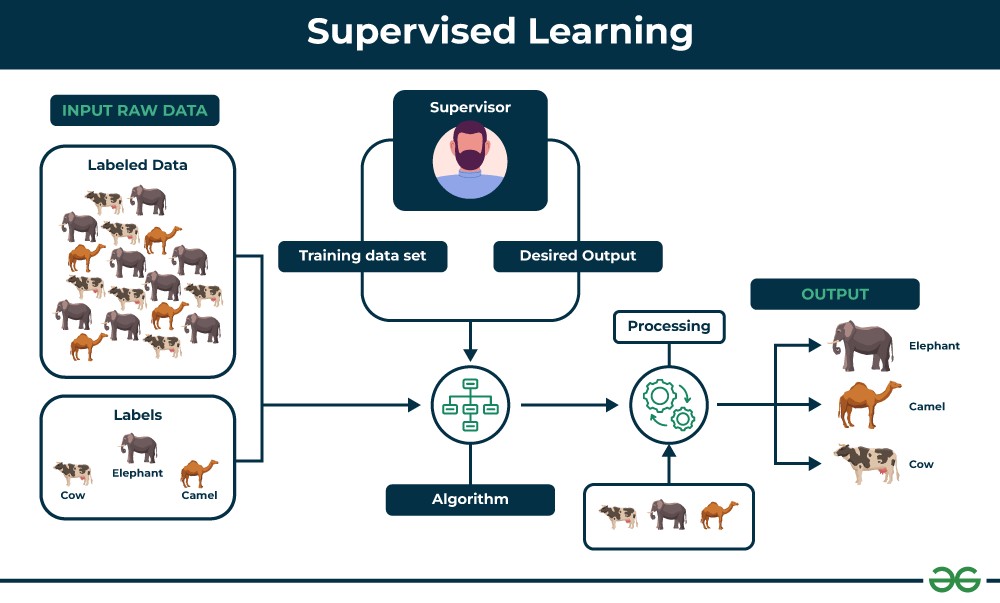 Supervised learning process diagram
Alt text: Diagram illustrating supervised learning, showing labeled data input, model training, and prediction on new data.
Key aspects of Supervised Learning:
- Labeled Data: Requires datasets where each input is paired with a correct output label.
- Learning by Example: Algorithms learn from these input-output pairs to generalize to new data.
- Prediction Focus: Aims to predict outcomes for new, unseen data based on learned patterns.
Illustrative Example:
Let’s revisit the fruit basket example. To train a supervised learning model to identify fruits:
-
Training Phase: The machine is fed labeled images of fruits. For instance:
- Images of apples are labeled “Apple.”
- Images of bananas are labeled “Banana.”
-
Feature Extraction: The algorithm analyzes features in the images, such as shape, color, and texture.
- Apples: Round shape, red color, smooth texture.
- Bananas: Elongated, curved shape, yellow color.
-
Learning the Mapping: The model learns to associate these features with the correct fruit labels.
-
Prediction Phase: When presented with a new, unlabeled image of a fruit (e.g., a banana), the model extracts its features and compares them to what it has learned. Based on similarity in shape and color to the “Banana” examples in its training data, it correctly identifies the new fruit as a banana.
Types of Supervised Learning Algorithms
Supervised learning algorithms are broadly categorized into two main types based on the type of output they predict:
1. Regression
Regression algorithms are used to predict continuous numerical values. The goal is to find a function that best fits the relationship between input variables and a continuous output variable.
Common Regression Algorithms:
- Linear Regression: Models the relationship between variables using a linear equation.
- Polynomial Regression: Extends linear regression to model non-linear relationships using polynomial equations.
- Support Vector Regression (SVR): Employs support vector machines for regression tasks.
- Decision Tree Regression: Uses decision trees to make predictions based on data features.
- Random Forest Regression: An ensemble method that combines multiple decision trees to improve prediction accuracy and robustness.
2. Classification
Classification algorithms are used to predict categorical values or class labels. The aim is to assign data points to predefined categories based on their features.
Common Classification Algorithms:
- Logistic Regression: Despite its name, it’s a classification algorithm used for binary classification problems.
- Support Vector Machines (SVM): Effective for both linear and non-linear classification by finding optimal hyperplanes to separate classes.
- Decision Trees: Tree-like structures that classify data by sequentially splitting it based on feature values.
- Random Forests: An ensemble of decision trees, often providing higher accuracy and robustness than single decision trees.
- Naive Bayes: A probabilistic classifier based on Bayes’ theorem, assuming feature independence.
Evaluating Supervised Learning Models
Evaluating the performance of supervised learning models is crucial to ensure they are accurate and reliable. Various metrics are used depending on whether the task is regression or classification.
Evaluation Metrics for Regression
- Mean Squared Error (MSE): Calculates the average squared difference between predicted and actual values. Lower MSE indicates better performance.
- Root Mean Squared Error (RMSE): The square root of MSE, providing an interpretable measure of prediction error in the original unit of the output variable. Lower RMSE is better.
- Mean Absolute Error (MAE): Measures the average absolute difference between predictions and actual values. Less sensitive to outliers than MSE and RMSE.
- R-squared (Coefficient of Determination): Represents the proportion of variance in the target variable explained by the model. Higher R-squared values (closer to 1) indicate a better fit.
Evaluation Metrics for Classification
- Accuracy: The percentage of correctly classified instances. While intuitive, it can be misleading with imbalanced datasets.
- Precision: Out of all instances predicted as positive, what proportion is actually positive? (True Positives / (True Positives + False Positives)).
- Recall (Sensitivity): Out of all actual positive instances, what proportion is correctly identified? (True Positives / (True Positives + False Negatives)).
- F1-Score: The harmonic mean of precision and recall, providing a balanced measure of a model’s performance, especially useful for imbalanced datasets.
- Confusion Matrix: A table summarizing the performance by showing counts of true positives, true negatives, false positives, and false negatives, offering detailed insights into the types of errors made by the classifier.
Applications of Supervised Learning
Supervised learning is widely applied across diverse domains:
- Spam Filtering: Classifying emails as spam or not spam based on email content and metadata.
- Image Classification: Automatically categorizing images into predefined classes (e.g., cats, dogs, cars).
- Medical Diagnosis: Predicting diseases based on patient data like symptoms, medical images, and test results.
- Fraud Detection: Identifying fraudulent transactions by analyzing patterns in financial data.
- Natural Language Processing (NLP): Tasks like sentiment analysis (determining the emotional tone of text) and machine translation rely heavily on supervised learning.
Advantages of Supervised Learning
- Leverages Labeled Data: Effectively utilizes labeled data to learn explicit mappings from inputs to outputs.
- Performance Optimization: Algorithms can be optimized to achieve high accuracy in prediction tasks.
- Solves Real-World Problems: Applicable to a vast array of real-world problems involving prediction and classification.
- Controlled Classification: Allows control over the number of classes and categories based on the labeled training data.
Disadvantages of Supervised Learning
- Need for Labeled Data: Requires substantial amounts of labeled data, which can be expensive and time-consuming to acquire.
- Computationally Intensive Training: Training complex models on large datasets can be computationally demanding and time-consuming.
- Limited to Known Outputs: Primarily effective for problems where the desired outputs are known and can be labeled in the training data.
- Big Data Challenges: Classifying extremely large datasets can pose scalability challenges.
What is Unsupervised Learning?
Unsupervised learning is a type of machine learning that learns from unlabeled data. In this approach, the data lacks pre-existing labels or classifications, and the algorithm’s task is to discover hidden patterns and structures within the data itself.
Imagine exploring a new, uncharted territory without a map. In unsupervised learning, the “territory” is the unlabeled dataset, and the algorithm acts as an explorer, seeking to understand the data’s inherent organization and relationships without any external guidance. The goal is to find meaningful groupings, reduce data complexity, or detect anomalies.
Consider analyzing animal data without knowing the species beforehand. Unsupervised learning can group animals based on their characteristics and behaviors, potentially revealing natural groupings that correspond to different species.
Alt text: Diagram illustrating unsupervised learning, showing unlabeled data input, pattern discovery, and insights output.
Key aspects of Unsupervised Learning:
- Unlabeled Data: Works with datasets that lack predefined categories or labels.
- Pattern Discovery: Aims to find hidden patterns, structures, and relationships in the data.
- No Explicit Guidance: Algorithms operate without a “teacher” or labeled examples, finding structure autonomously.
Illustrative Example:
Suppose you have a collection of images containing both dogs and cats, but none of the images are labeled. Using unsupervised learning:
-
Unlabeled Data Input: The algorithm receives the set of unlabeled images.
-
Feature Extraction: The model analyzes image features like shape, texture, and color patterns.
-
Pattern Identification: The algorithm identifies clusters of images based on similarities in features. It might notice that some images share features like pointy ears and whiskers, while others have floppy ears and different facial structures.
-
Clustering: The images are grouped into clusters based on these identified patterns. The model might form two clusters, one containing images predominantly of dogs and the other of cats, even without being told what “dog” or “cat” means.
-
Insight Generation: The unsupervised learning process reveals the inherent grouping in the data, effectively separating dogs from cats based on visual features alone.
Types of Unsupervised Learning Algorithms
Unsupervised learning algorithms are broadly categorized into:
1. Clustering
Clustering algorithms group similar data points together based on their inherent characteristics. The aim is to partition the data into distinct clusters where data points within a cluster are more similar to each other than to those in other clusters.
Common Clustering Types & Algorithms:
- Partitioning Clustering (e.g., K-Means): Divides data into non-overlapping clusters. K-Means aims to minimize the within-cluster variance.
- Hierarchical Clustering: Creates a hierarchy of clusters, either agglomerative (bottom-up) or divisive (top-down).
- Density-Based Clustering (e.g., DBSCAN): Identifies clusters as dense regions separated by sparser regions, effective for finding clusters of arbitrary shapes and handling noise.
- Distribution-Based Clustering (e.g., Gaussian Mixture Models – GMMs): Assumes data points are generated from a mixture of probability distributions, often Gaussian distributions.
2. Association Rule Learning
Association rule learning aims to discover interesting relationships or associations between variables in large datasets. It identifies rules that describe frequent co-occurrence patterns.
Common Association Rule Learning Algorithms:
- Apriori Algorithm: A classic algorithm for frequent itemset mining and association rule learning.
- Eclat Algorithm: An efficient algorithm for frequent itemset mining using vertical data format.
- FP-Growth Algorithm: Another efficient algorithm for frequent itemset mining that avoids candidate generation, using a tree-based data structure.
Evaluating Unsupervised Learning Models
Evaluating unsupervised learning models is more challenging than supervised models because there are no “correct answers” or labels to compare against directly. Evaluation often relies on intrinsic metrics and domain expertise.
Evaluation Metrics for Clustering
- Silhouette Score: Measures how well each data point fits within its cluster and how separated clusters are. Ranges from -1 to +1, with higher scores indicating better clustering.
- Calinski-Harabasz Score: Calculates the ratio of between-cluster variance to within-cluster variance. Higher scores suggest better-defined clusters.
- Davies-Bouldin Index: Measures the average similarity ratio of each cluster with its most similar cluster. Lower scores indicate better clustering (less similarity between clusters).
- Adjusted Rand Index (if ground truth labels are available): Measures the similarity between cluster assignments and known class labels, adjusted for chance. Ranges from -1 to +1, with higher scores indicating better agreement with ground truth.
Evaluation Metrics for Association Rule Learning
Evaluation in association rule learning often focuses on the interpretability and usefulness of the discovered rules, rather than purely numerical metrics. Common metrics used to assess rules include:
- Support: The frequency of an itemset or rule in the dataset.
- Confidence: The conditional probability of the consequent given the antecedent in a rule.
- Lift: Measures how much more often the antecedent and consequent of a rule occur together than expected by chance.
Applications of Unsupervised Learning
Unsupervised learning is crucial in various applications:
- Anomaly Detection: Identifying unusual data points or patterns that deviate from the norm, used in fraud detection, network intrusion detection, and equipment failure prediction.
- Customer Segmentation: Grouping customers based on purchasing behavior or demographics for targeted marketing and personalized services.
- Recommendation Systems: Recommending products, movies, or music to users based on their past behavior and preferences by identifying similar user groups and item patterns.
- Dimensionality Reduction: Reducing the number of variables in a dataset while preserving essential information, used for data visualization and feature extraction.
- Scientific Discovery: Uncovering hidden patterns and relationships in scientific data, leading to new hypotheses and insights in fields like biology, astronomy, and social sciences.
Advantages of Unsupervised Learning
- No Labeled Data Required: Works with readily available unlabeled data, reducing the cost and effort of data annotation.
- Pattern Discovery: Excels at uncovering previously unknown patterns and structures in data, leading to new insights.
- Dimensionality Reduction: Effective for reducing data complexity and extracting meaningful features.
- Insight Generation: Helps gain valuable insights from unlabeled data that might be missed with other methods.
Disadvantages of Unsupervised Learning
- Difficult to Evaluate Accuracy: Assessing the accuracy and effectiveness is challenging due to the lack of ground truth labels.
- Less Accurate Results: Results can sometimes be less precise compared to supervised learning when specific prediction is the goal.
- Interpretation Required: Requires human expertise to interpret and label the discovered clusters or patterns, which can be subjective.
- Sensitivity to Data Quality: Can be sensitive to noise, outliers, and missing values in the data, potentially affecting the quality of results.
Supervised vs. Unsupervised Machine Learning: A Comparative Table
| Feature | Supervised Machine Learning | Unsupervised Machine Learning |
|---|---|---|
| Input Data | Labeled data | Unlabeled data |
| Learning Type | Learning with supervision | Learning without supervision |
| Goal | Predict output for new data | Discover patterns and structures |
| Complexity | Generally simpler | Computationally more complex |
| Accuracy | Typically higher accuracy | Potentially lower accuracy |
| Number of Classes | Known in advance | Often unknown, discovered by algorithm |
| Data Analysis | Offline analysis | Real-time or offline analysis |
| Algorithms (Examples) | Linear Regression, Logistic Regression, SVM, Decision Trees, Random Forests | K-Means, Hierarchical Clustering, DBSCAN, Apriori, PCA |
| Output | Desired output is predefined | Desired output is not predefined |
| Training Data Use | Uses training data to build model | No explicit training data in the same way |
| Model Complexity | Can be complex but limited by labeled data | Can handle more complex models due to data exploration |
| Model Testing | Model performance can be directly tested | Model evaluation is more subjective |
| Commonly Called | Classification or Regression | Clustering or Association |
| Example Application | Image classification (labeled images) | Customer segmentation (unlabeled data) |
| Need for Supervision | Requires supervision during training | No supervision needed during training |
Conclusion
Supervised and unsupervised learning represent two fundamental yet distinct approaches within machine learning. Supervised learning excels when we have labeled data and a clear target to predict, making it ideal for tasks like classification and regression. Unsupervised learning, on the other hand, shines when dealing with unlabeled data and the goal is to explore data, discover hidden patterns, and gain insights. Choosing between supervised and unsupervised learning depends heavily on the nature of the data available and the specific problem you aim to solve. Often, a combination of both approaches can be highly effective in tackling complex real-world challenges.
Frequently Asked Questions (FAQs)
1. What is the fundamental difference between supervised and unsupervised machine learning?
The core difference lies in the data they use for training. Supervised learning uses labeled data where each data point has a known output, while unsupervised learning uses unlabeled data and aims to find patterns without explicit output guidance.
2. When should I use supervised learning?
Use supervised learning when you have a labeled dataset and want to predict a specific outcome for new data. Common applications include classification (categorizing data) and regression (predicting continuous values).
3. What are some typical applications of unsupervised learning?
Unsupervised learning is well-suited for tasks like customer segmentation, anomaly detection, recommendation systems, and dimensionality reduction. It’s used when the goal is to explore data and discover hidden structures or patterns.
4. Can unsupervised learning be used before supervised learning?
Yes, absolutely. Unsupervised learning techniques like dimensionality reduction or clustering can be used as a preprocessing step to extract features or group data before applying supervised learning algorithms. This can improve the performance and efficiency of supervised models.
5. Is one type of learning always better than the other?
No, neither is universally “better.” The choice depends entirely on the problem and the available data. Supervised learning is powerful for prediction when labeled data is available, while unsupervised learning is invaluable for exploration and pattern discovery in unlabeled data. They serve different but often complementary purposes in machine learning.
Next Article Supervised and Unsupervised Learning in R Programming