The F1 score in machine learning is a crucial metric for gauging the performance of classification models, balancing precision and recall, and its understanding is paramount for ensuring model reliability. At LEARNS.EDU.VN, we recognize the importance of model evaluation. This article explores the F1 score, its applications, and limitations, offering solutions to address the challenges in machine learning model assessment. Discover how to optimize your model’s performance with this essential metric and related evaluation strategies, leading to improved accuracy and actionable insights, with focus on model performance evaluation.
1. Evaluation Metrics in Machine Learning: A Comprehensive Overview
Evaluation metrics are essential for enhancing the effectiveness, accuracy, efficiency, and overall quality of machine learning models by offering objective and quantitative performance assessments. These metrics allow data scientists and machine learning engineers to fine-tune their models for optimal performance and make informed decisions.
1.1 The Significance of Evaluation Metrics in ML Tasks
In machine learning tasks, evaluation metrics offer crucial insights into various aspects of model performance. These encompass data quality, correctness, error types, bias, and fairness.
- Insights into Model Performance: Evaluation metrics reveal critical aspects of a model’s behavior, such as its precision, recall, and accuracy, providing a comprehensive understanding of its strengths and weaknesses.
- Reliability and Correctness Assessment: These metrics assess the reliability and correctness of a model’s predictions, ensuring that the outputs are consistent and trustworthy.
- Model Selection Guidance: By enabling a fair comparison of different model variants, evaluation metrics guide model selection, ensuring the best model is chosen for the specific task.
- Hyperparameter Tuning: Evaluation metrics inform the hyperparameter tuning process, helping to optimize model parameters for superior performance.
- Identification of Model Limitations: These metrics identify model limitations, allowing for targeted improvements and refinements.
- Support for Stakeholder Decision-Making: Evaluation metrics aid stakeholders in making informed decisions, providing a clear and objective basis for assessing model performance.
Using multiple metrics is standard practice in ML, as a model may excel in one metric but perform poorly in another. In such instances, practitioners strive to balance these metrics to achieve optimal overall performance. LEARNS.EDU.VN provides resources and guidance to help you navigate these complex evaluations.
1.2 Task-Specific Evaluation Metrics
Different ML tasks have unique objectives, and their models possess distinct parameters and properties. Consequently, a universal approach to evaluating ML models across different tasks is not feasible.
| Task Category | Evaluation Metrics | Description |
|---|---|---|
| Classification | Accuracy, Precision, Recall, F1 Score, AUC-ROC | Assess the model’s ability to correctly classify data into different categories, balancing the trade-offs between false positives and false negatives. |
| Regression | Mean Squared Error (MSE), Root Mean Squared Error (RMSE), Mean Absolute Error (MAE), R-squared | Measure the accuracy of predicted continuous values, focusing on the magnitude and distribution of errors. |
| Clustering | Silhouette Score, Dunn Index, Rand Index | Evaluate the quality of clusters formed by the model, considering factors like cluster cohesion and separation. |
| Ranking & Recommendation | MAP, NDCG, Precision at K | Assess the model’s ability to rank items in a relevant order and recommend the most appropriate items to users. |
Understanding the specific objectives and characteristics of each ML task is crucial for selecting the most appropriate evaluation metrics. For example, in classification tasks, metrics like the F1 score are particularly useful when dealing with imbalanced datasets or when balancing precision and recall is critical. LEARNS.EDU.VN offers in-depth explanations and resources to guide you in choosing the right metrics for your specific needs.
2. Fundamentals of Classification Metrics: An In-Depth Exploration
Classification tasks typically fall into two categories: binary classification, involving datasets with two classes or labels, and multi-class classification, involving datasets with more than two classes. Classification models, or classifiers, predict labels or classes for given data.
2.1 Understanding Classification Prediction Outcomes
Classifiers can produce four possible outcomes:
- True Positives (TP): Events correctly predicted as positive.
- True Negatives (TN): Events accurately predicted as negative.
- False Positives (FP): Events wrongly predicted as positive when they were negative.
- False Negatives (FN): Events wrongly predicted as negative when they were positive.
Most classification metrics, including accuracy, precision, recall (sensitivity or true positive rate), specificity (true negative rate), F1 score (harmonic mean of precision and recall), and area under the ROC curve (AUC-ROC), utilize these four outcomes to calculate metric values.
2.2 Leveraging the Confusion Matrix
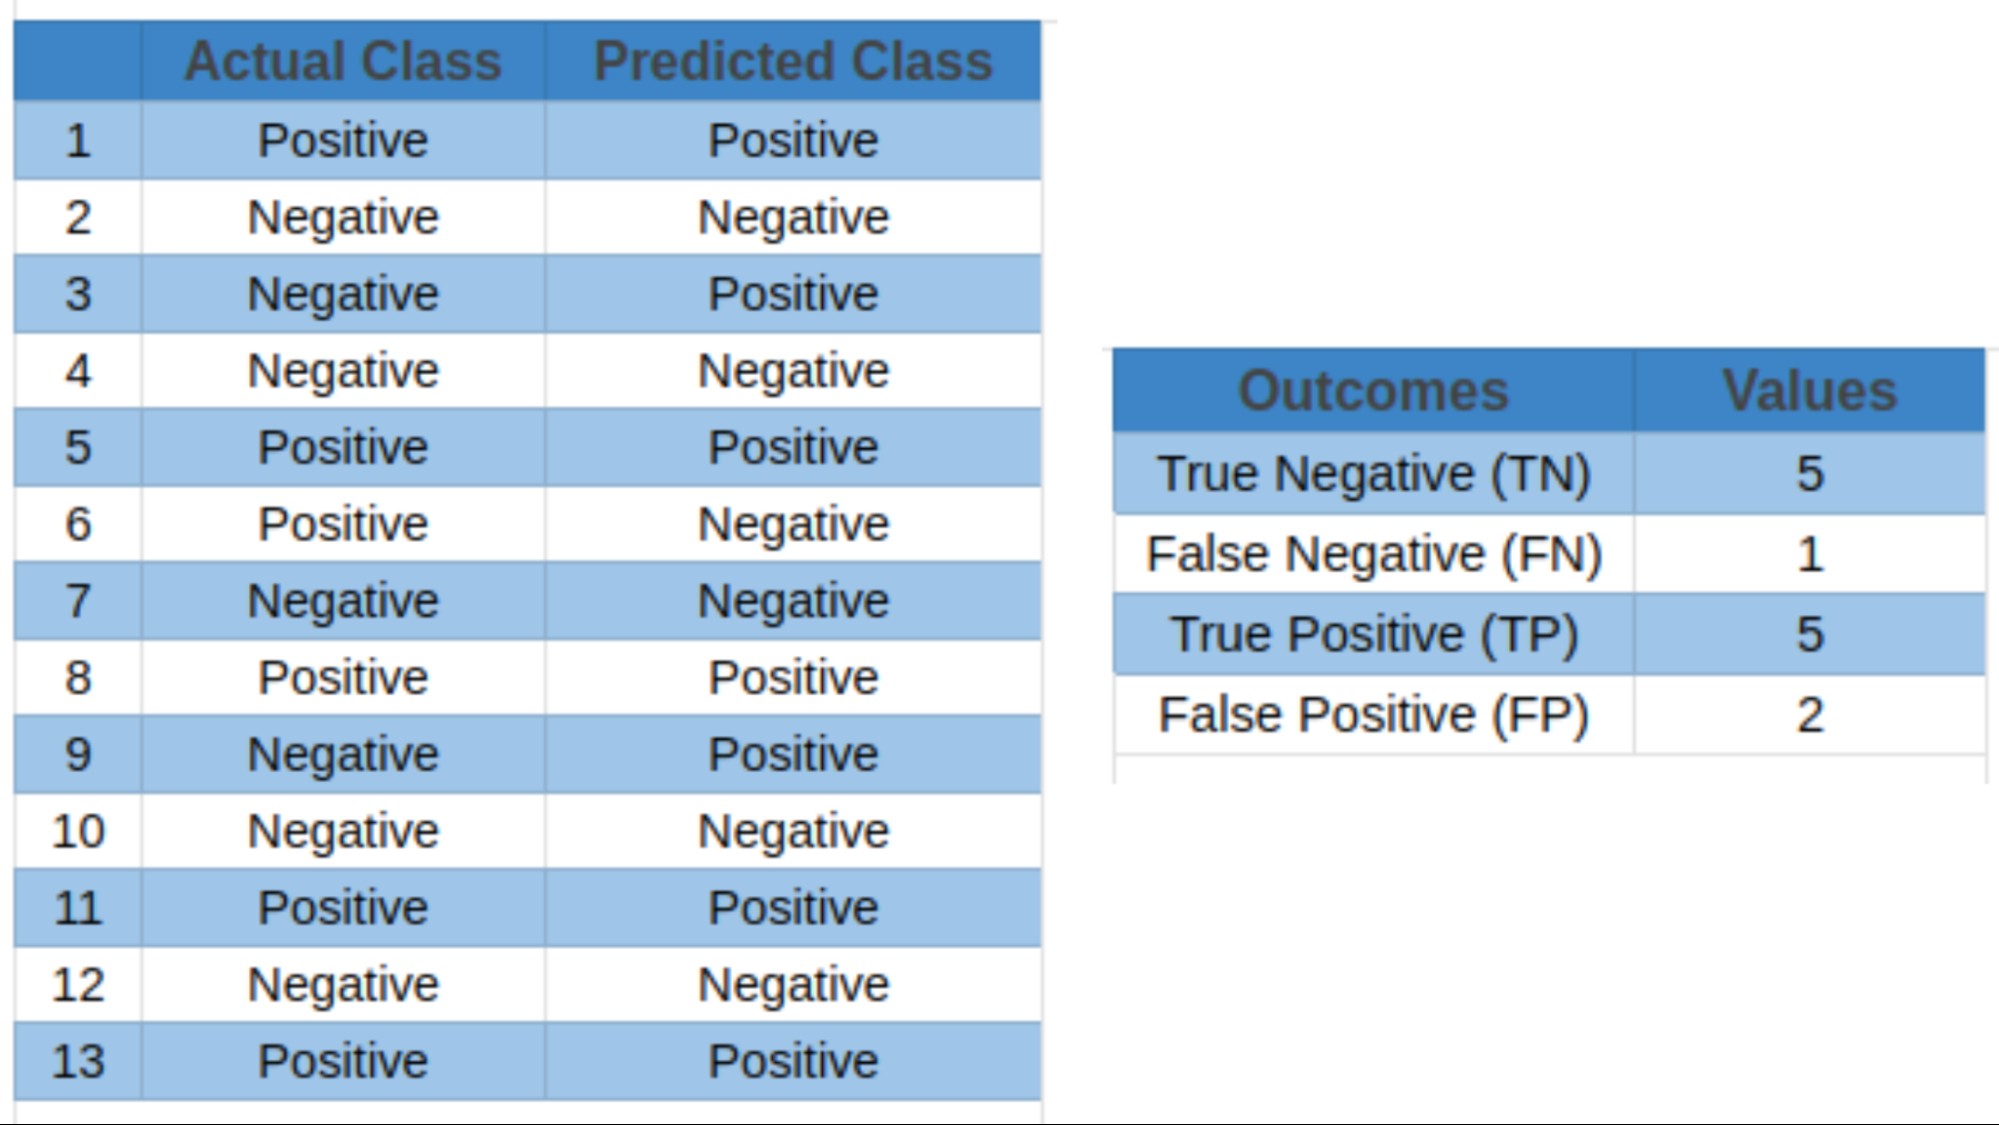
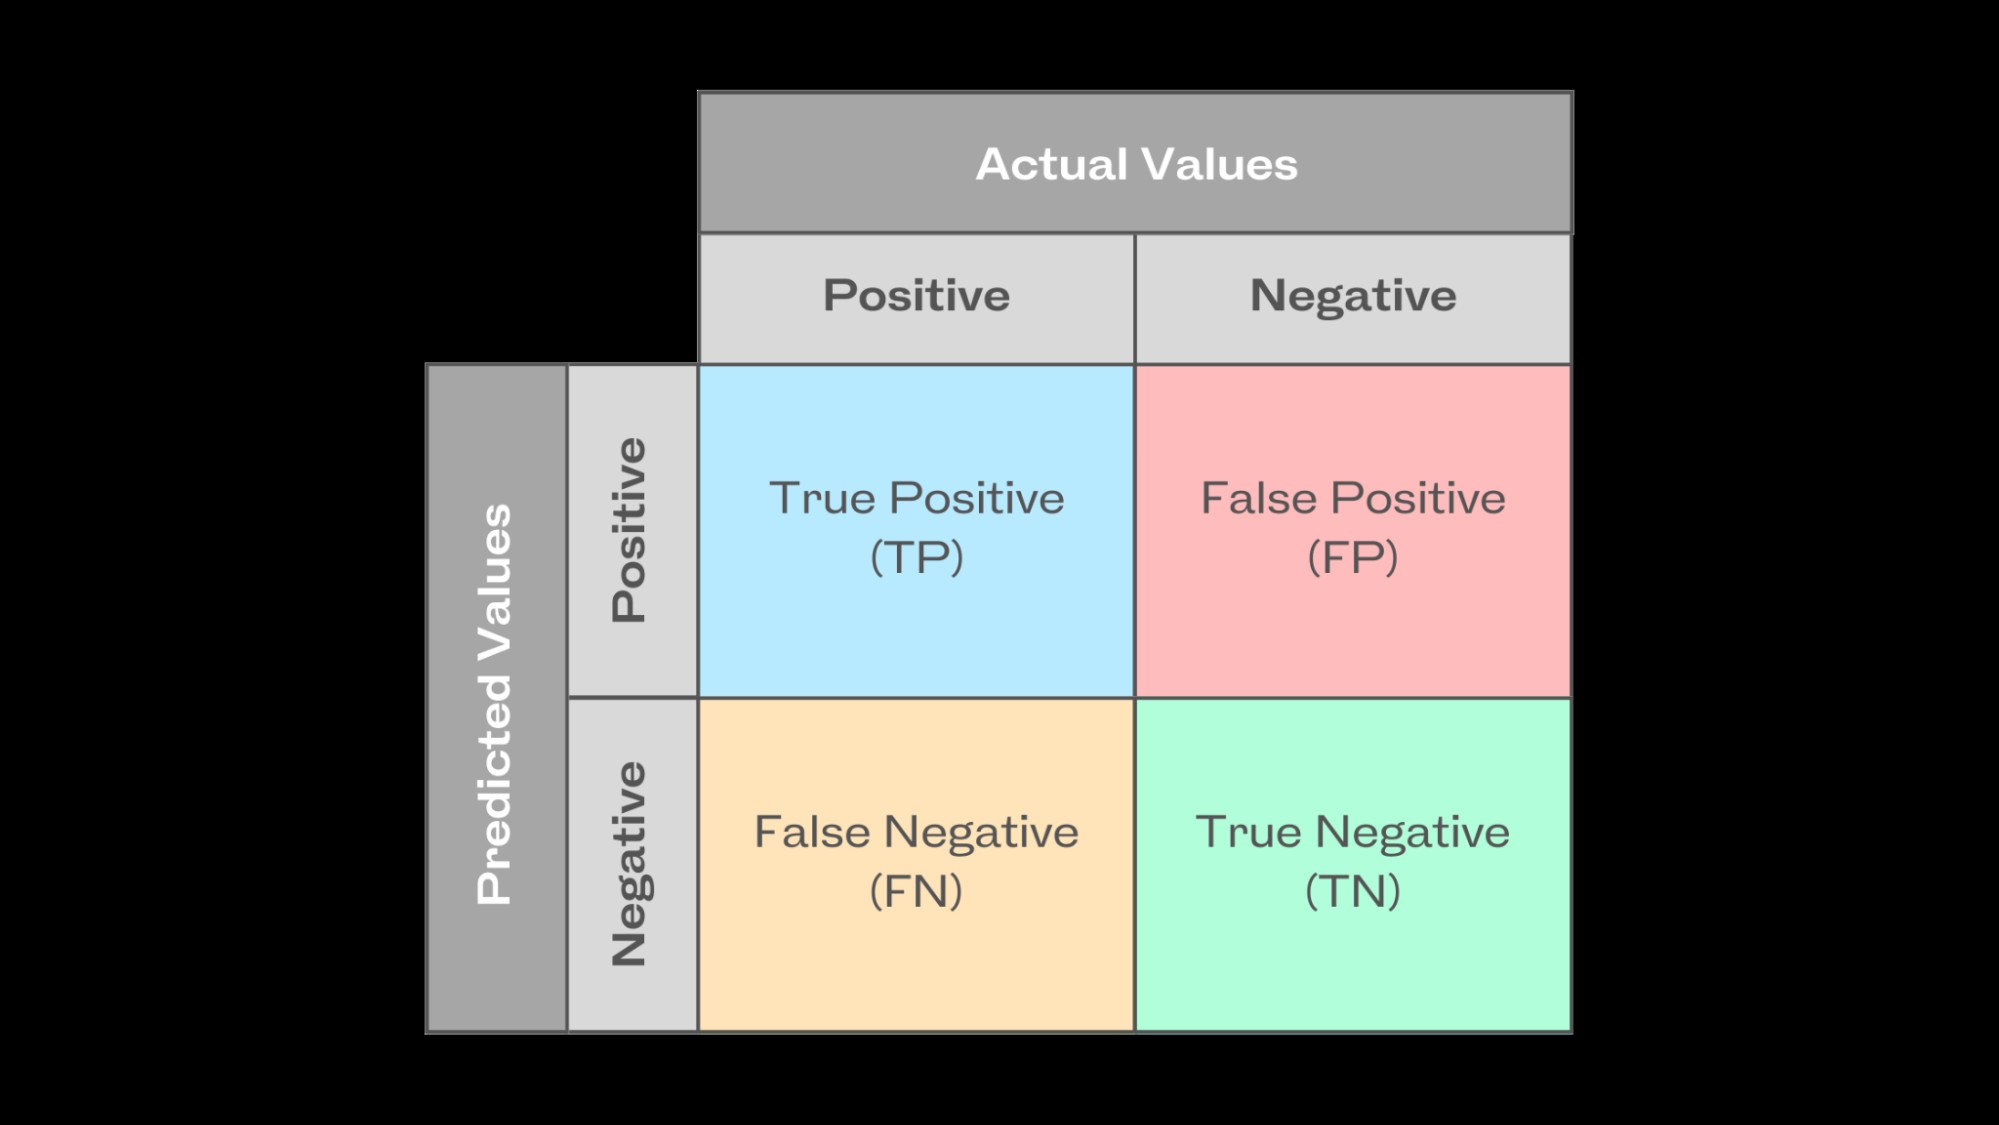
A confusion matrix is an effective tool for evaluating the performance of a classification model by mapping its actual and predicted values. In binary classification tasks, it is a table displaying the four prediction outcomes: true positives, true negatives, false positives, and false negatives.
This matrix allows ML practitioners to summarize prediction outcomes and easily calculate the model’s precision, recall, F1 score, and other metrics. Consider the following example:
| Predicted Positive | Predicted Negative | |
|---|---|---|
| Actual Positive | True Positive | False Negative |
| Actual Negative | False Positive | True Negative |
This confusion matrix provides a clear and concise overview of the model’s performance, highlighting areas where it excels and areas that need improvement. LEARNS.EDU.VN offers detailed tutorials on constructing and interpreting confusion matrices to optimize your model evaluation process.
2.3 Deep Dive into Accuracy, Precision, and Recall
2.3.1 Accuracy
Accuracy calculates the overall prediction correctness by dividing the number of correctly predicted positive and negative events by the total number of events. The formula for calculating accuracy is:
Accuracy = (True Positives + True Negatives) / (Total Events)
Let’s use the following data to calculate the accuracy of a simple classification model:
True Positives = 65
True Negatives = 80
False Positives = 15
False Negatives = 40
Accuracy = (65 + 80) / (65 + 80 + 15 + 40) = 145 / 200 = 0.725
Typically, an accuracy score above 0.7 indicates average model performance, while a score above 0.9 suggests a good model. However, the relevance of the score is determined by the task. Accuracy alone may not provide a complete picture of model performance, especially in scenarios where class imbalance exists in the dataset.
2.3.2 Precision
Precision determines the quality of positive predictions by measuring their correctness. It is the number of true positive outcomes divided by the sum of true positive and false positive predictions. The formula is:
Precision = True Positives / (True Positives + False Positives)
Using the classification model outcomes from the previous example, precision is calculated as:
Precision = 65 / (65 + 15) = 65 / 80 = 0.8125
Precision can be thought of as a quality metric; higher precision indicates that an algorithm provides more relevant results than irrelevant ones. It focuses solely on the correctness of positive predictions, without considering the correct detection of negative predictions.
2.3.3 Recall
Recall, also called sensitivity, measures the model’s ability to detect positive events correctly. It is the percentage of accurately predicted positive events out of all actual positive events. The formula to calculate recall is:
Recall = True Positives / (True Positives + False Negatives)
Using the classification model outcomes from the previous example, recall is calculated as:
Recall = 65 / (65 + 40) = 65 / 105 = 0.619
A high recall score indicates that the classifier predicts the majority of the relevant results correctly. However, the recall metric does not account for the potential repercussions of false positives, i.e., occurrences that are wrongly identified as positive – a false alarm. Ideally, we want to avoid such cases, especially in mission-critical applications such as intrusion detection, where a non-malicious false alarm increases the workload of overburdened security teams.
While precision and recall provide useful information individually, they have limitations when viewed separately. Ideally, we aim to build classifiers with both high precision and recall, but this is not always possible. A classifier with high recall may have low precision, meaning it captures most positive classes but produces a considerable number of false positives. Therefore, we use the F1 score metric to balance this precision-recall trade-off. LEARNS.EDU.VN offers resources and courses to help you understand and optimize these metrics for your specific applications.
3. F1 Score Metric: Balancing Precision and Recall
The F1 score, or F-measure, is the harmonic mean of the precision and recall of a classification model. The two metrics contribute equally to the score, ensuring that the F1 metric accurately indicates the reliability of a model.
3.1 Understanding the Harmonic Mean
Calculating the F1 score using the arithmetic mean may not appropriately represent the model’s overall performance, especially when precision and recall have significantly varied values. The arithmetic mean focuses on the sum of values and their average, while the harmonic mean emphasizes the reciprocal of values. It is computed by dividing the total number of values by the sum of their reciprocals. Hence, it enhances the effect of the smaller value on the overall calculation to achieve a balanced measurement.
3.2 The F1 Score Formula
The F1 score formula is:
F1 Score = 2 (Precision Recall) / (Precision + Recall)
Using the classification model outcomes from the previous example:
Precision = 0.8125
Recall = 0.619
F1 Score = 2 (0.8125 0.619) / (0.8125 + 0.619) = 2 * 0.503 / 1.4315 = 1.006 / 1.4315 = 0.703
Here, you can observe that the harmonic mean of precision and recall creates a balanced measurement, i.e., the model’s precision is not optimized at the price of recall, or vice versa. Hence, the F1 score shows a strong performance in recognizing positive cases while minimizing false positives and false negatives. This makes it a suitable metric when recall and precision must be optimized simultaneously, especially in imbalanced datasets. As a result, the F1 score metric directs real-world decision-making more accurately.
LEARNS.EDU.VN provides practical examples and tutorials on how to calculate and interpret the F1 score to optimize your machine learning models.
4. Interpreting the F1 Score: A Practical Guide
The F1 score ranges between 0 and 1, with 0 denoting the lowest possible result and 1 denoting a flawless result, where the model accurately predicted each label.
4.1 General Guidelines for Interpretation
- High F1 Score: Indicates a well-balanced performance, demonstrating that the model can concurrently attain high precision and high recall.
- Low F1 Score: Signifies a trade-off between recall and precision, implying that the model has trouble striking that balance.
As a general rule of thumb, the F1 score value can be interpreted as follows:
| F1 Score Range | Interpretation | Implications |
|---|---|---|
| 0.0 – 0.3 | Very Poor | The model struggles to balance precision and recall, resulting in a low overall performance. Significant improvements are needed. |
| 0.3 – 0.5 | Poor | The model has difficulty in achieving both high precision and high recall. It may be better at one metric than the other, but the overall performance is suboptimal. |
| 0.5 – 0.7 | Moderate | The model shows a reasonable balance between precision and recall. While it performs adequately, there is room for improvement to enhance both metrics simultaneously. |
| 0.7 – 0.9 | Good | The model demonstrates a strong balance between precision and recall. It is reliable and effective in most scenarios, making it a suitable choice for many applications. |
| 0.9 – 1.0 | Excellent | The model achieves exceptional performance with high precision and high recall. It accurately predicts both positive and negative cases, indicating minimal errors. This is ideal for critical applications where accuracy is paramount. |
However, depending on the task requirements, model use case, and the tolerance for mistakes, the precise threshold for what is considered “low” might also change. For instance, a simple decision tree classifier and a multi-layered deep learning neural network would have different ranges for high or low F1 scores. LEARNS.EDU.VN offers specialized resources to help you set appropriate benchmarks for your specific models and applications.
4.2 Real-World Application Scenarios
Now, let’s consider various ML applications where model evaluation requires a balance of precision and recall, deeming the F1 score as a more suitable evaluation metric.
5. ML Applications of F1 Score: Use Cases and Examples
The F1 score is particularly valuable in applications where balancing precision and recall is crucial. Here are some key areas where the F1 score is widely used:
5.1 Medical Diagnostics: Ensuring Accurate Detection
In medical diagnostics, it is important to acquire a high recall while correctly detecting positive occurrences, even if doing so necessitates losing precision. For instance, the F1 score of a cancer detection classifier should minimize the possibility of false negatives, i.e., patients with malignant cancer wrongly predicted as benign.
Imagine a scenario where a cancer detection model has a high recall but low precision. This means it correctly identifies most cancer cases (high recall) but also flags many healthy patients as potentially having cancer (low precision). This situation is undesirable because it leads to unnecessary stress, further testing, and potential overtreatment for healthy individuals. Conversely, a model with high precision but low recall would correctly identify almost all patients it flags as having cancer but would miss many actual cancer cases. This is even more dangerous, as it could delay necessary treatment for those individuals.
Therefore, using the F1 score helps to balance the need to identify as many actual cancer cases as possible (high recall) while also minimizing the number of healthy patients who are wrongly flagged (high precision). This balance is critical in medical diagnostics, where the consequences of both false positives and false negatives can be severe. The F1 score ensures that the model is optimized to provide the most accurate and reliable results, reducing both unnecessary interventions and missed diagnoses.
LEARNS.EDU.VN provides resources and case studies demonstrating how the F1 score is applied in medical diagnostics to enhance the accuracy and reliability of diagnostic tools.
5.2 Sentiment Analysis: Gauging Public Opinion
For natural language processing (NLP) tasks like sentiment analysis, recognizing both positive and negative sentiments in textual data allows businesses to assess public opinion, consumer feedback, and brand sentiment. Hence, the F1 score allows for an efficient evaluation of sentiment analysis models by taking precision and recall into account when categorizing sentiments.
Consider a social media analytics company that uses sentiment analysis to gauge public opinion about a new product. A model with high precision would accurately identify most positive sentiments but might miss some negative sentiments (low recall). Conversely, a model with high recall would capture most negative sentiments but might also misclassify some neutral or positive sentiments as negative (low precision).
In this context, it is essential to balance the two. Missing negative sentiments (false negatives) could lead the company to underestimate customer dissatisfaction, while misclassifying neutral or positive sentiments as negative (false positives) could lead to unwarranted alarm and unnecessary interventions. The F1 score helps to balance these concerns, ensuring that the sentiment analysis model accurately captures the overall sentiment landscape.
By optimizing the F1 score, the company can make informed decisions based on a reliable assessment of public opinion. This includes identifying real issues that need to be addressed and avoiding unnecessary reactions based on misclassified data. The F1 score ensures that the model is both accurate in identifying positive sentiments and comprehensive in capturing negative sentiments, providing a balanced and reliable view of public opinion.
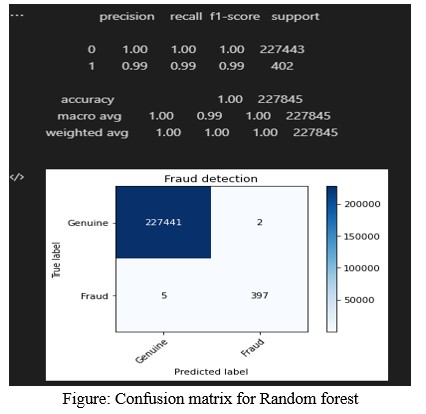
5.3 Fraud Detection: Identifying and Preventing Financial Crimes
In fraud detection, by considering both precision (the accuracy with which fraudulent cases are discovered) and recall (the capacity to identify all instances of fraud), the F1 score enables practitioners to assess fraud detection models more accurately.
In fraud detection, the cost of both false positives and false negatives can be significant. A false positive (flagging a legitimate transaction as fraudulent) can lead to customer inconvenience and dissatisfaction, while a false negative (failing to detect a fraudulent transaction) can result in financial losses.
In this context, the F1 score helps to balance the need to identify as many fraudulent transactions as possible (high recall) while also minimizing the number of legitimate transactions that are wrongly flagged (high precision). By optimizing the F1 score, financial institutions can ensure that their fraud detection models are both effective in preventing fraud and considerate of customer experience. This involves setting the right thresholds to minimize both missed fraud cases and unnecessary disruptions to legitimate transactions.
LEARNS.EDU.VN offers resources and training modules on how to apply the F1 score in fraud detection to enhance the accuracy and effectiveness of fraud prevention systems.
6. Limitations of F1 Score: What You Need to Know
ML practitioners must be aware of the following limits and caveats of the F1 score when interpreting its results.
6.1 Dataset Class Imbalance: Handling Unequal Distributions
For imbalanced data, when one class significantly outweighs the other, the regular F1 score metric might not give a true picture of the model’s performance. This is because the regular F1 score gives precision and recall equal weight, but in datasets with imbalances, achieving high precision or recall for the minority class may result in a lower F1 score due to the majority class’s strong influence.
Imagine a disease detection model where only 1% of the population has the disease. If the model predicts that no one has the disease, it would be 99% accurate. However, this model is not useful because it fails to identify the 1% of people who actually have the disease.
In such cases, the F1 score helps to highlight the model’s performance on the minority class. If the model has a low F1 score, it indicates that the model is not effectively identifying the minority class. To address this issue, techniques such as oversampling the minority class or undersampling the majority class can be used to balance the dataset. Additionally, using different evaluation metrics, such as the area under the receiver operating characteristic curve (AUC-ROC), can provide a more comprehensive view of the model’s performance.
LEARNS.EDU.VN offers resources and courses on how to handle class imbalance in datasets and select the appropriate evaluation metrics for imbalanced datasets.
6.2 Cost Associated with False Prediction Outcomes: Assessing Real-World Impact
False positives and false negatives can have quite diverse outcomes depending on the application. In medical diagnostics, as discussed earlier, a false negative is more dangerous than a false positive. Hence, the F1 score must be interpreted carefully.
In spam detection, a false positive (classifying a legitimate email as spam) can cause a user to miss important information, while a false negative (failing to classify a spam email as spam) can result in the user receiving unwanted and potentially harmful emails.
In this context, it is important to consider the cost of each type of error. Missing an important email might be more costly than receiving a few spam emails, or vice versa. Therefore, the evaluation metric should reflect these costs. The F1 score can be adjusted to prioritize precision or recall, depending on the specific needs of the application. Additionally, techniques such as cost-sensitive learning can be used to train models that explicitly minimize the cost of errors.
6.3 Contextual Dependence: Tailoring the F1 Score to the Task
The evaluation of the F1 score varies depending on the particular problem domain and task objectives. Various interpretations of what constitutes a high or low F1 score for different applications require various precision-recall criteria. Hence, a thorough understanding of the domain and the task at hand is needed to use and interpret the F1 score properly.
For example, in fraud detection, a high F1 score is critical because both false positives and false negatives can have significant financial consequences. However, in a different application, such as content recommendation, the F1 score might be less critical because the cost of errors is lower.
7. F-Score Variants: Adapting the Metric to Specific Needs
To resolve severe class imbalance issues and achieve an appropriate balance between precision and recall, practitioners often use the following two variants of the F-score metric:
7.1 F2 Score: Prioritizing Recall
This variant places more emphasis on recall than precision. It is suitable for circumstances where detecting true positives is crucial. During the harmonic mean computation, recall is given more weightage.
The F2 score formula is as follows:
F2 Score = 5 (Precision Recall) / (4 * Precision + Recall)
In medical diagnostics, a false negative (missing a disease) is often more dangerous than a false positive (incorrectly diagnosing a disease). In such cases, the F2 score can be used to prioritize recall, ensuring that as many actual cases of the disease are detected as possible.
7.2 F-beta Score: Adjusting the Balance
This variant offers a dynamic blend of recall and precision by changing the beta parameter — weight coefficient which should be greater than 0. Based on the particular task requirements, practitioners can change the beta value, i.e., beta < 1 favors precision, and beta > 1 favors recall.
The F-beta score is calculated using the same formula as the F2 score, with beta dictating the importance of recall against precision.
F-beta Score = (1 + beta^2) (Precision Recall) / (beta^2 * Precision + Recall)
In spam detection, if it is more important to avoid false positives (classifying a legitimate email as spam), a beta value less than 1 can be used to prioritize precision. Conversely, if it is more important to avoid false negatives (failing to classify a spam email as spam), a beta value greater than 1 can be used to prioritize recall.
8. Supplementing the F1 Score: Additional Metrics for Comprehensive Evaluation
Other performance metrics, such as the Area Under the Curve-Receiver Operating Characteristic Curve (AUC-ROC), can be used in addition to the F1 score to offer supplementary insights into an artificial intelligence model performance.
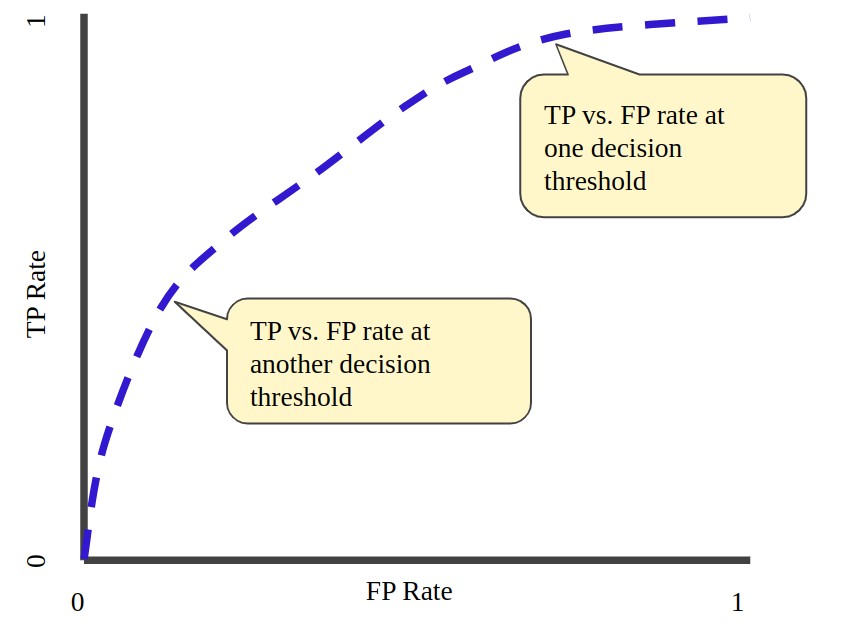
The AUC-ROC metric evaluates the model’s capability to differentiate between positive and negative classes across various classification criteria or decision thresholds by plotting the true positive rate (TPR) versus the false positive rate (FPR).
The AUC-ROC provides a single scalar value that summarizes the overall performance of the model. An AUC-ROC of 0.5 indicates that the model is no better than random guessing, while an AUC-ROC of 1.0 indicates that the model perfectly distinguishes between positive and negative classes. The AUC-ROC is particularly useful when the class distribution is imbalanced or when the cost of false positives and false negatives is different.
LEARNS.EDU.VN offers detailed explanations and resources on how to calculate and interpret the AUC-ROC and other performance metrics to provide a comprehensive evaluation of your machine learning models.
9. Future Research for F1 Score: Advancements and Directions
As data science grows, researchers and practitioners continue to investigate the challenges posed by imbalanced datasets. Modified F1 scores that account for class imbalance are being developed to improve performance evaluation.
9.1 Fairness and Ethics in Evaluation Measures
Another important area of focus for evaluation measures is fairness and ethics. The goal is to ensure that metrics take into account fairness towards specific subgroups or protected traits in addition to overall performance.
Traditional evaluation metrics, such as accuracy and F1 score, can be biased if the dataset contains biases. For example, a facial recognition system might perform well overall but perform poorly for certain ethnic groups. To address this issue, researchers are developing fairness metrics that measure the performance of the model across different subgroups. These metrics can help to identify and mitigate biases in machine learning models.
9.2 Risk-Adjusted Return for Financial Tasks
Moreover, another research proposes a new discriminant metric to gauge how well AI models perform in maximizing risk-adjusted return for financial tasks after arguing that metrics like the F1 score were unsatisfactory for evaluation.
In financial applications, the goal is not just to make accurate predictions but also to maximize returns while minimizing risk. Traditional evaluation metrics do not take risk into account. Therefore, researchers are developing new metrics that measure the risk-adjusted return of machine learning models. These metrics can help to optimize models for financial tasks.
10. Optimize Your Machine Learning Models with LEARNS.EDU.VN
Are you looking to enhance your understanding of machine learning and optimize your model’s performance? At LEARNS.EDU.VN, we offer a wide range of resources and courses designed to help you master the complexities of machine learning. Whether you’re a student, a working professional, or an educator, our platform provides the tools and knowledge you need to succeed.
10.1 Comprehensive Educational Resources
We understand that finding reliable and high-quality learning materials can be challenging. That’s why LEARNS.EDU.VN is committed to providing detailed, easy-to-understand articles and tutorials on various topics, including the F1 score and other essential evaluation metrics. Our resources are designed to explain complex concepts in a simple and intuitive manner, making learning accessible to everyone.
10.2 Effective Learning Methodologies
At LEARNS.EDU.VN, we believe that learning should be engaging and effective. We offer proven learning methodologies to help you achieve your learning goals. Our courses include step-by-step guides, practical examples, and real-world case studies to ensure you gain a thorough understanding of the subject matter.
10.3 Expert Guidance and Support
Navigating the world of machine learning can be daunting, but you don’t have to do it alone. LEARNS.EDU.VN connects you with experienced educators and industry experts who can provide guidance and support. Whether you need help understanding a concept, choosing the right evaluation metric, or optimizing your model’s performance, our team is here to assist you.
10.4 Clear Learning Pathways
Not sure where to start? LEARNS.EDU.VN offers clear learning pathways tailored to different skill levels and interests. Whether you’re a beginner or an advanced learner, our structured learning paths will guide you through the essential concepts and skills you need to succeed.
10.5 A Wealth of Resources and Tools
LEARNS.EDU.VN provides access to a variety of resources and tools to support your learning journey. From comprehensive articles and tutorials to interactive quizzes and hands-on projects, we have everything you need to master machine learning.
10.6 Get Started Today
Don’t let the challenges of machine learning hold you back. Visit LEARNS.EDU.VN today to explore our resources and courses. Take the first step towards mastering machine learning and unlocking your full potential.
For further information, please visit our website at LEARNS.EDU.VN or contact us at 123 Education Way, Learnville, CA 90210, United States, or via Whatsapp at +1 555-555-1212.
FAQ: Understanding the F1 Score
1. What is the F1 score in machine learning?
The F1 score is a metric that balances precision and recall, providing a single score to evaluate the performance of classification models. It is especially useful when dealing with imbalanced datasets or when both false positives and false negatives are costly.
2. How is the F1 score calculated?
The F1 score is calculated as the harmonic mean of precision and recall using the formula: F1 Score = 2 (Precision Recall) / (Precision + Recall).
3. What is considered a good F1 score?
A good F1 score typically ranges from 0.7 to 0.9, indicating a strong balance between precision and recall. However, the interpretation of the F1 score can vary depending on the specific application and task requirements.
4. Why is the F1 score important?
The F1 score is important because it provides a balanced measure of a model’s performance, considering both the accuracy of positive predictions (precision) and the ability to detect all positive cases (recall).
5. When should I use the F1 score?
You should use the F1 score when you need to balance precision and recall, especially in scenarios where both false positives and false negatives have significant consequences.
6. What are the limitations of the F1 score?
The F1 score can be misleading in cases of severe class imbalance. Additionally, it may not fully capture the cost associated with false prediction outcomes in certain applications.
7. What are the variants of the F1 score?
The variants of the F1 score include the F2 score, which prioritizes recall, and the F-beta score, which allows for adjusting the balance between precision and recall based on task requirements.
8. How can I improve the F1 score of my model?
To improve the F1 score, you can adjust the model’s parameters, balance the dataset, use different evaluation metrics, or apply cost-sensitive learning techniques.
9. Can the F1 score be used for multi-class classification?
Yes, the F1 score can be extended to multi-class classification by calculating the F1 score for each class and then averaging them using methods like micro-averaging, macro-averaging, or weighted-averaging.
10. Where can I learn more about the F1 score and machine learning?
You can learn more about the F1 score and machine learning at learns.edu.vn, which offers comprehensive resources, tutorials, and courses to help you master these topics.