Are you trying to evaluate the performance of your classification models? The F1 score in machine learning is a crucial metric. At LEARNS.EDU.VN, we will explore its significance, calculation, and applications to help you understand how to use it effectively and improve your model’s reliability. Discover how the F1 measure balances precision and recall for optimal assessment.
1. Evaluation Metrics in Machine Learning: Why They Matter
Evaluation metrics are crucial for assessing and refining machine learning (ML) models. These metrics offer quantitative insights into a model’s performance, covering various aspects like accuracy, efficiency, and overall effectiveness. By providing a structured way to measure performance, evaluation metrics help in several key areas:
- Performance Insights: Evaluation metrics offer essential insights into the performance of ML models. They shed light on various aspects, including data quality, correctness, error types, bias, and fairness. This detailed analysis enables data scientists to understand the strengths and limitations of their models, leading to more informed improvements.
- Reliability Assessment: Evaluating the reliability and correctness of a model’s predictions is vital. Metrics help ensure that the model’s outputs are trustworthy, which is particularly important in applications where decisions based on these predictions can have significant consequences.
- Model Selection: Selecting the right model is simplified with evaluation metrics. These metrics allow for a fair comparison of different model variations, helping practitioners choose the one that best fits their specific needs.
- Hyperparameter Tuning: Evaluation metrics play a key role in hyperparameter tuning. By tracking how different hyperparameter settings affect model performance, data scientists can fine-tune their models for optimal results.
- Limitation Identification: Identifying a model’s limitations is crucial for ongoing improvement. Metrics help uncover areas where the model struggles, paving the way for targeted enhancements.
- Informed Decision-Making: Evaluation metrics provide stakeholders with the data needed to make well-informed decisions. This ensures that models are used appropriately and aligned with business goals.
Using multiple metrics is vital, as models may excel in one area but underperform in another. Data scientists aim to strike a balance across various metrics to achieve comprehensive model effectiveness.
1.1 Tailoring Evaluation Metrics to Specific ML Tasks
Different machine learning tasks require different evaluation metrics. There’s no one-size-fits-all approach. Each task has unique objectives, and models have distinct parameters.
- Classification: Accuracy, precision, recall, F1 score, and AUC-ROC are key metrics.
- Regression: Mean Squared Error (MSE), Root Mean Squared Error (RMSE), Mean Absolute Error (MAE), and R-squared are common choices.
- Clustering: The Silhouette score, Dunn index, and Rand index are typically used.
- Ranking & Recommendation: MAP, NDCG, and precision at K are frequently employed.
Table 2: Machine Learning Tasks and Their Common Evaluation Metrics
LEARNS.EDU.VN offers detailed resources to help you understand and apply these metrics effectively. For example, understanding the nuances of computer vision metrics can significantly improve your projects. Before diving into the F1 score, it’s essential to grasp the fundamentals of classification metrics.
2. Understanding Classification Metrics: The Foundation
Classification tasks involve categorizing data into distinct classes. These tasks are generally split into binary classification (two classes) and multi-class classification (more than two classes).
2.1 Possible Outcomes in Classification Predictions
When evaluating classifiers, there are four possible outcomes:
- True Positives (TP): Correctly predicted positive events.
- True Negatives (TN): Correctly predicted negative events.
- False Positives (FP): Incorrectly predicted positive events (Type I error).
- False Negatives (FN): Incorrectly predicted negative events (Type II error).
Most classification metrics, including accuracy, precision, recall, specificity, F1 score, and AUC-ROC, rely on these outcomes to calculate performance.
Table 3: Outcomes of a Binary Classification Model
2.2 The Power of the Confusion Matrix
The confusion matrix is a powerful tool for evaluating classification models. It maps actual and predicted values, providing a clear view of the model’s performance. In binary classification, it’s a 2×2 table showing true positives, true negatives, false positives, and false negatives. This matrix helps calculate precision, recall, F1 score, and other key metrics.
Illustration of a Confusion Matrix
2.3 Key Metrics: Accuracy, Precision, and Recall
2.3.1 Accuracy
Accuracy measures the overall correctness of predictions. It’s calculated by dividing the number of correct predictions by the total number of predictions:
Accuracy = (TP + TN) / (TP + TN + FP + FN)
Let’s use the data from Table 3 to calculate the accuracy:
Accuracy = (60 + 80) / (60 + 80 + 10 + 50) = 140 / 200 = 0.7
An accuracy score above 0.7 often indicates average model performance, while a score above 0.9 suggests a good model. However, accuracy alone can be misleading, especially with imbalanced datasets.
2.3.2 Precision
Precision measures the quality of positive predictions. It’s the number of true positives divided by the sum of true positives and false positives:
Precision = TP / (TP + FP)
Using the same data, precision is calculated as:
Precision = 60 / (60 + 10) = 60 / 70 ≈ 0.857
High precision means the algorithm returns more relevant results than irrelevant ones, focusing solely on the correctness of positive predictions.
2.3.3 Recall
Recall, also known as sensitivity, measures the model’s ability to detect positive events correctly. It’s the percentage of accurately predicted positive events out of all actual positive events:
Recall = TP / (TP + FN)
Using the data from Table 3, recall is:
Recall = 60 / (60 + 50) = 60 / 110 ≈ 0.545
A high recall score indicates that the classifier correctly predicts most relevant results. However, recall doesn’t account for false positives, which can be problematic in mission-critical applications.
Ideally, classifiers should have both high precision and high recall. However, this is often challenging. A high-recall classifier may have low precision, capturing most positive classes but producing many false positives. To balance this trade-off, we use the F1 score.
3. The F1 Score Metric: Balancing Precision and Recall
The F1 score, or F-measure, is the harmonic mean of precision and recall. It balances both metrics, providing a reliable measure of a model’s performance. The F1 score ensures that both precision and recall contribute equally to the overall score, making it a robust indicator of a model’s effectiveness.
It’s important to use the harmonic mean rather than the arithmetic mean because the harmonic mean emphasizes the reciprocal of the values, giving more weight to smaller values. This prevents overestimation when precision and recall values vary significantly.
The formula for the F1 score is:
F1 Score = 2 (Precision Recall) / (Precision + Recall)
Using the data from Table 3, the F1 score is:
F1 Score = 2 (0.857 0.545) / (0.857 + 0.545) ≈ 2 * (0.467) / (1.402) ≈ 0.666
The harmonic mean balances precision and recall, ensuring that neither is optimized at the expense of the other. The F1 score performs well in identifying positive cases while minimizing false positives and false negatives. This makes it particularly useful for imbalanced datasets.
4. Interpreting the F1 Score: What Does It Tell You?
The F1 score ranges from 0 to 1, where 0 is the worst possible score and 1 is the best, indicating perfect prediction of labels.
- High F1 Score: Indicates balanced performance, with both high precision and high recall.
- Low F1 Score: Suggests an imbalance between precision and recall.
The following interpretations can be used as a general guideline:
| F1 Score Range | Interpretation |
|---|---|
| 0.0 – 0.2 | Very Poor |
| 0.2 – 0.4 | Poor |
| 0.4 – 0.6 | Moderate |
| 0.6 – 0.8 | Good |
| 0.8 – 1.0 | Excellent |

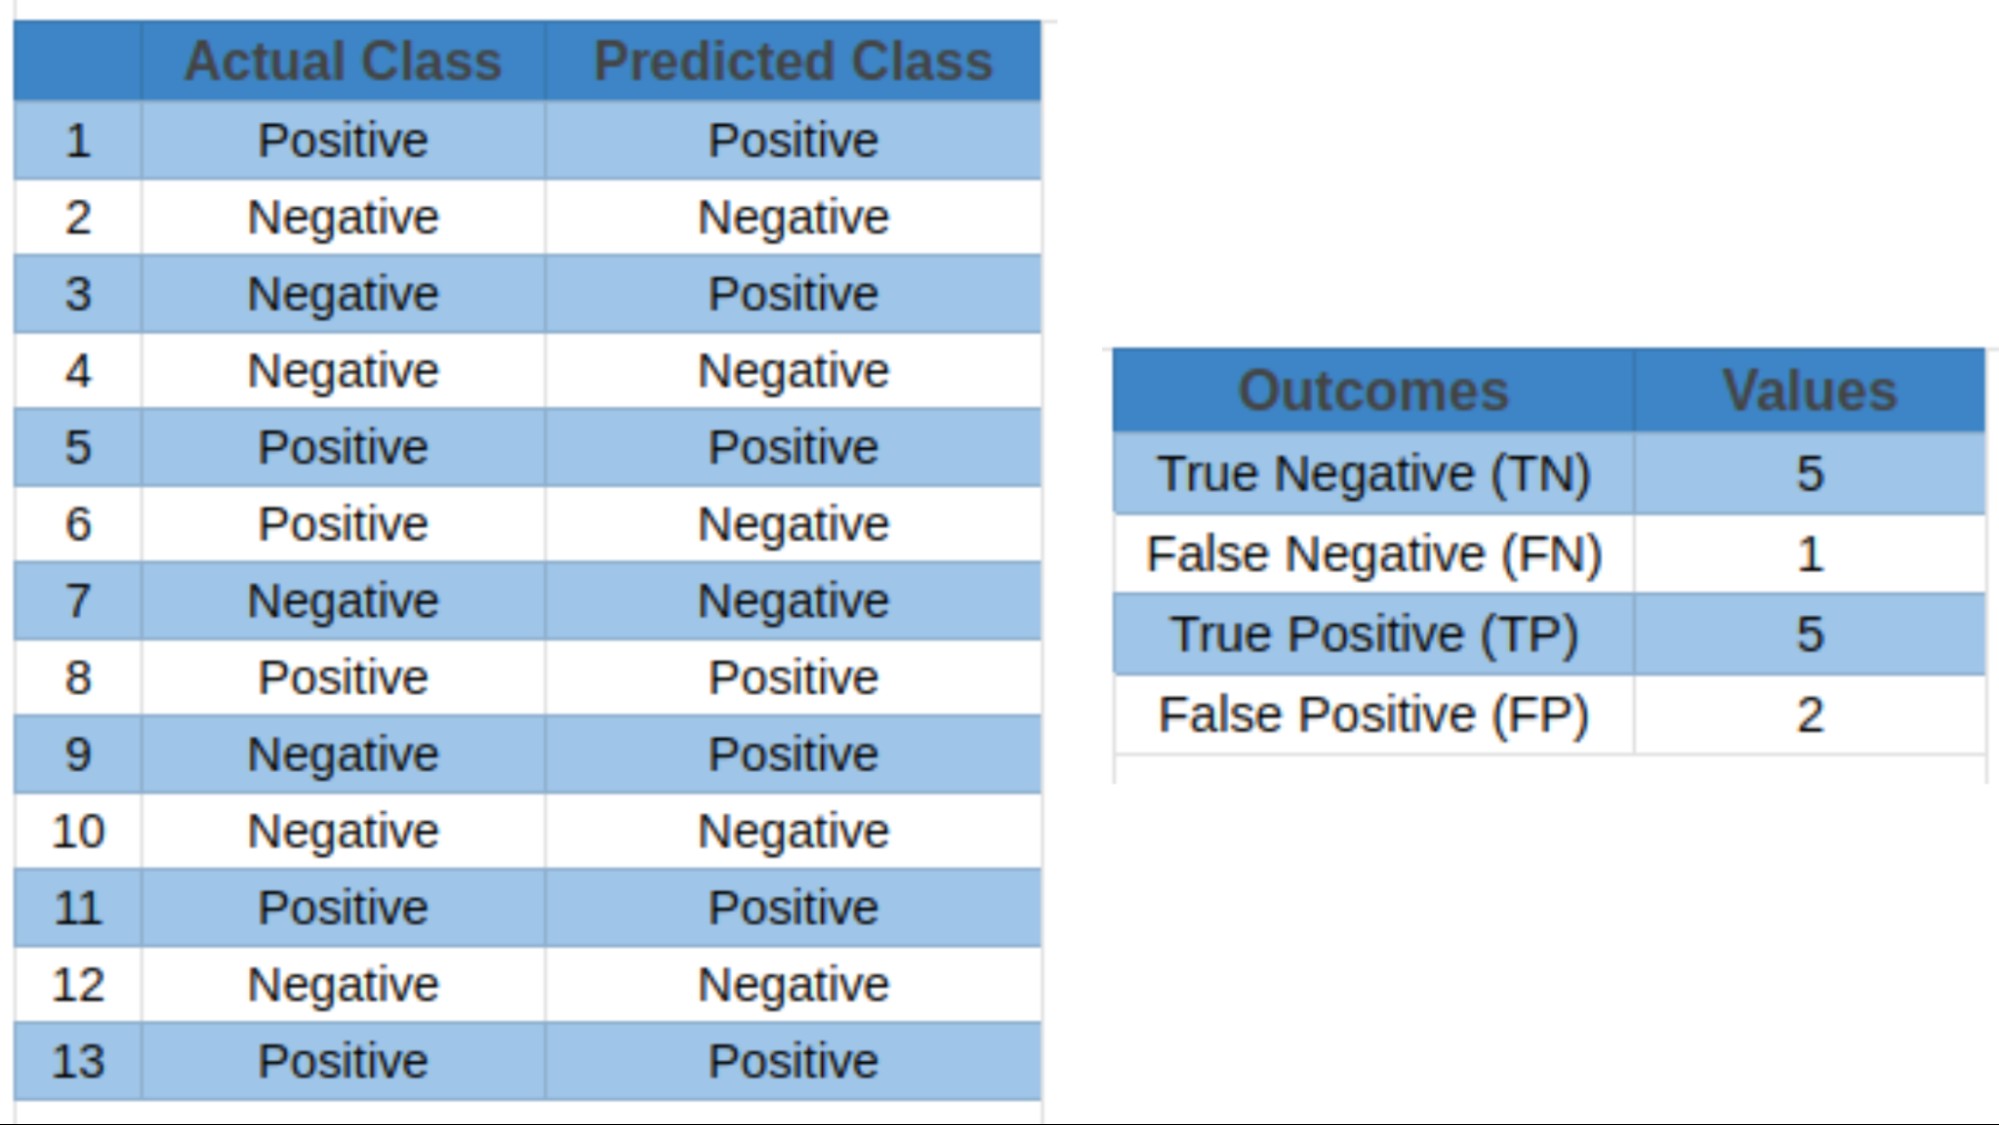
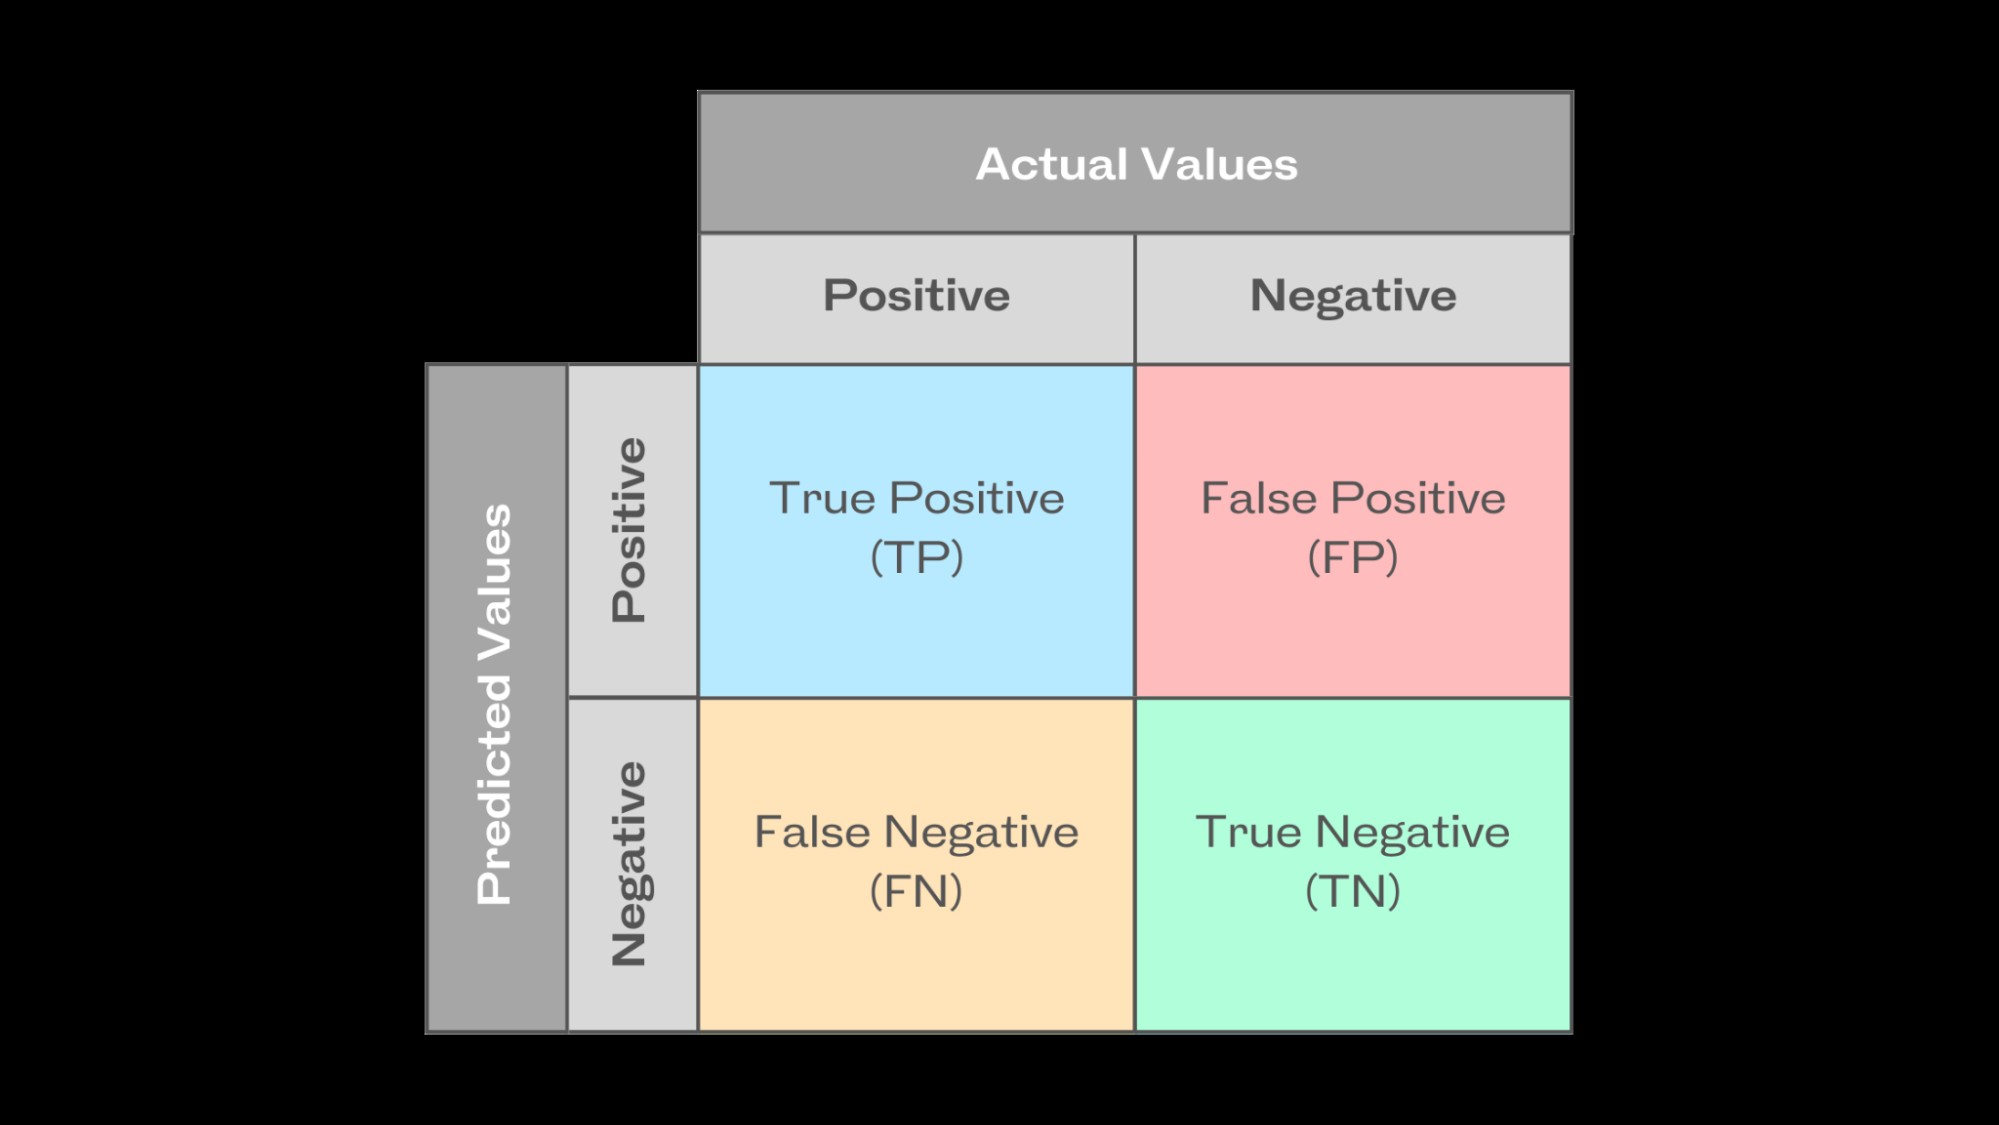
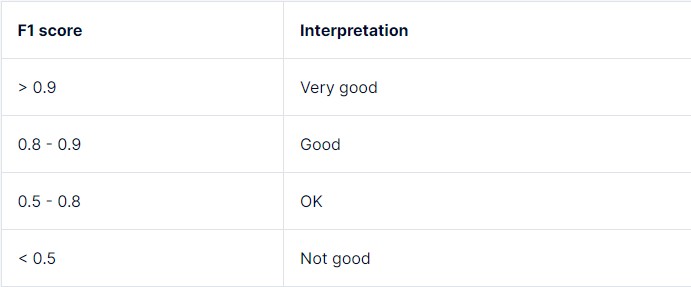
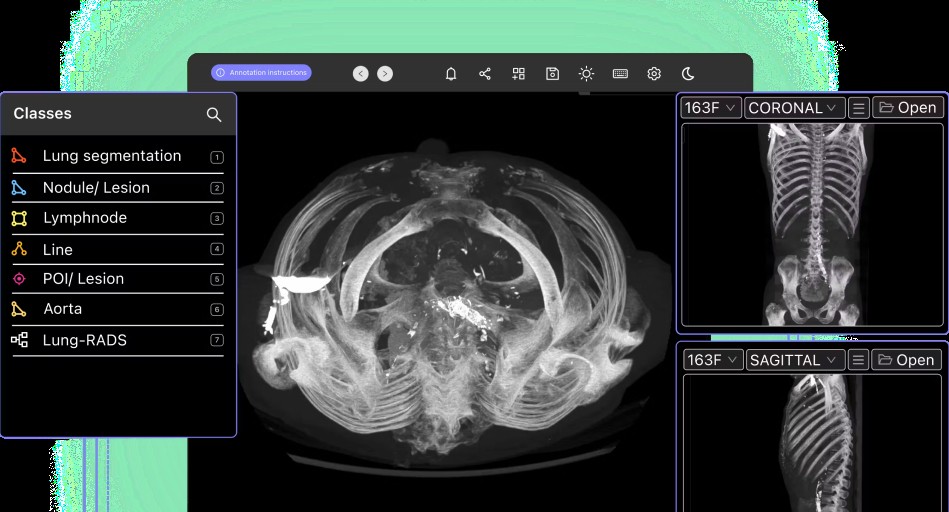
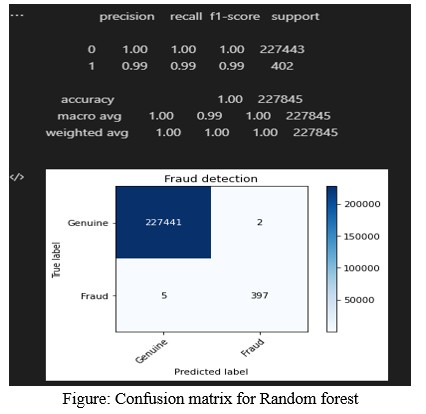
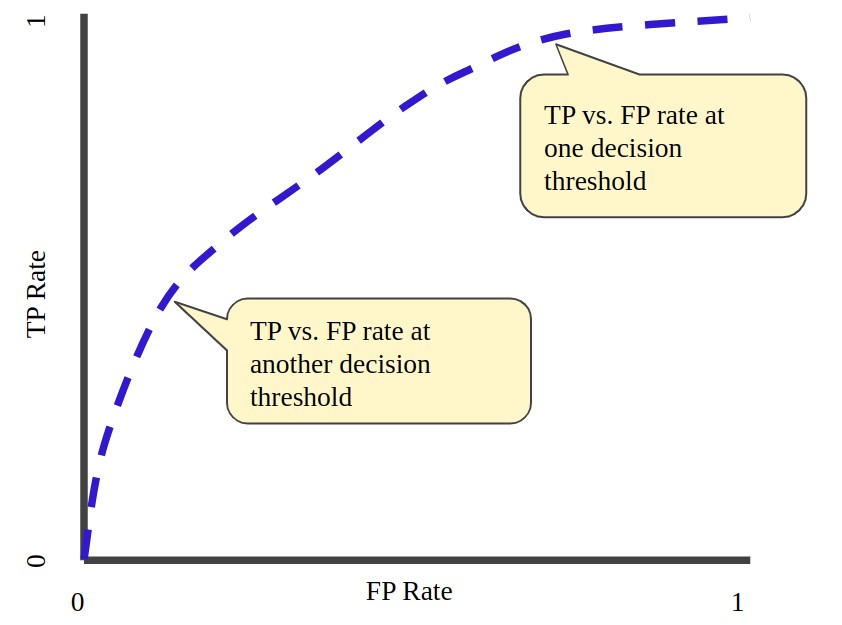
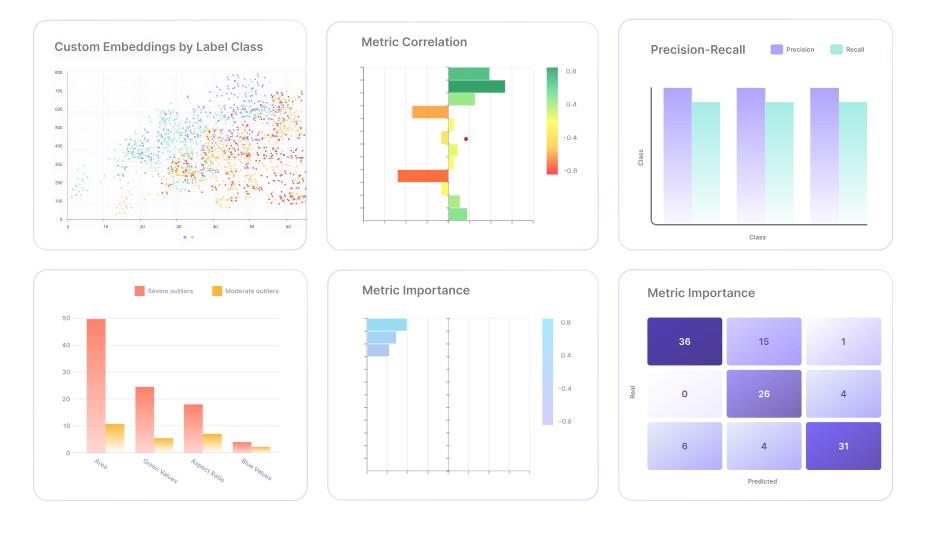
Table 4: F1 Score Interpretation Guide
However, these thresholds can vary depending on the specific task, use case, and tolerance for errors. A simple decision tree and a complex neural network, for example, will have different ranges for what is considered a high or low F1 score.
5. Real-World Applications of the F1 Score
The F1 score is particularly useful in applications where balancing precision and recall is critical.
5.1 Medical Diagnostics: Prioritizing Recall
In medical diagnostics, high recall is vital to correctly identify positive cases, even if it means sacrificing some precision. For example, a cancer detection classifier should minimize false negatives (patients with cancer incorrectly classified as benign).
Collaborative DICOM annotation platform for medical imaging, including CT, X-ray, mammography, MRI, PET scans, and ultrasound, can greatly benefit from accurate F1 scores to ensure reliable diagnostics.
5.2 Sentiment Analysis: Understanding Customer Feedback
Sentiment analysis in natural language processing (NLP) requires recognizing both positive and negative sentiments to assess public opinion, customer feedback, and brand sentiment. The F1 score efficiently evaluates sentiment analysis models by balancing precision and recall in sentiment categorization.
5.3 Fraud Detection: Identifying Fraudulent Activities
In fraud detection, the F1 score assesses models more accurately by considering both precision (correctly identified fraudulent cases) and recall (ability to identify all instances of fraud). This is particularly important in financial applications where both types of errors can have significant consequences.
Table 5: Evaluation Metrics for a Credit Card Fraud Detection Model
6. Limitations and Caveats of the F1 Score
While the F1 score is a valuable metric, it has limitations that practitioners should be aware of.
6.1 Impact of Class Imbalance
The standard F1 score may not accurately represent performance in imbalanced datasets, where one class significantly outweighs the other. Because the F1 score gives equal weight to precision and recall, achieving high precision or recall for the minority class may result in a lower F1 score due to the majority class’s influence.
LEARNS.EDU.VN provides resources on addressing class imbalance in datasets to help you build more robust models.
6.2 Cost of False Predictions
False positives and false negatives can have different consequences depending on the application. In medical diagnostics, a false negative is often more dangerous than a false positive. Therefore, the F1 score must be interpreted carefully, considering the specific costs associated with each type of error.
6.3 Contextual Dependence
The interpretation of the F1 score varies based on the specific problem domain and task objectives. Different applications require different precision-recall criteria, and a thorough understanding of the domain is needed to use and interpret the F1 score properly.
7. F-Score Variants: Tailoring the Metric
To address class imbalance issues and balance precision and recall, practitioners often use the following F-score variants:
7.1 F2 Score: Emphasizing Recall
The F2 score places more emphasis on recall than precision, making it suitable for situations where detecting true positives is crucial. During the harmonic mean computation, recall is given more weight.
The F2 score formula is:
F2 Score = 5 (Precision Recall) / (4 * Precision + Recall)
7.2 F-beta Score: Dynamic Balancing
The F-beta score offers a dynamic blend of recall and precision by adjusting the beta parameter. Practitioners can change the beta value based on specific task requirements (beta < 1 favors precision; beta > 1 favors recall).
The F-beta score is calculated using:
F-beta Score = (1 + beta^2) (Precision Recall) / (beta^2 * Precision + Recall)
8. Supplementing the F1 Score with AUC-ROC
In addition to the F1 score, other performance metrics like the Area Under the Curve-Receiver Operating Characteristic Curve (AUC-ROC) can provide valuable insights into a model’s performance.
The AUC-ROC metric evaluates the model’s ability to differentiate between positive and negative classes across various classification criteria by plotting the true positive rate (TPR) against the false positive rate (FPR).
Table 6: True Positive vs. False Positive Rate at Different Classification Thresholds
9. Future Research Directions for the F1 Score
Ongoing research aims to improve the F1 score to address challenges like imbalanced datasets and ensure fairness in evaluations.
Researchers are exploring modified F1 scores that account for class imbalance to improve performance evaluation. Focus is also being placed on fairness and ethics to ensure metrics consider fairness towards specific subgroups or protected traits.
Additionally, new metrics are being proposed to better gauge the performance of AI models in specific tasks, such as financial tasks, where traditional metrics like the F1 score may be insufficient.
10. Evaluating Models with Encord Active
Encord Active is an ML platform designed to help practitioners build better models by offering tools for evaluation and improvement. It provides features such as:
- Evaluation metrics visualization with intuitive charts and graphs.
- Automated identification of labeling errors.
- Natural language search for curating high-value visual data.
- Tools to find and fix bias, drift, and dataset errors.
- Automated robustness tests to identify model failure modes.
- Detailed metrics evaluation for comparing datasets and models.
Encord Active offers various evaluation approaches, including the F1 score, accuracy, precision, and recall, with an intuitive user interface for quick and easy model evaluation.
Table 7: Encord Active Features for Model Evaluation
By understanding and applying the F1 score, you can effectively evaluate and improve your machine learning models.
Frequently Asked Questions (FAQ)
- What is the F1 score in machine learning?
The F1 score is the harmonic mean of precision and recall, used to evaluate the performance of classification models. It balances false positives and false negatives. - Why is the F1 score important?
It is especially useful when you need to balance precision and recall, particularly in imbalanced datasets. - How is the F1 score calculated?
The F1 score is calculated as: F1 Score = 2 (Precision Recall) / (Precision + Recall). - What is a good F1 score?
An F1 score above 0.8 is generally considered good, indicating a strong balance between precision and recall. - What are the limitations of the F1 score?
The F1 score may not be suitable for highly imbalanced datasets or when the costs of false positives and false negatives are very different. - How does the F1 score differ from accuracy?
Accuracy measures overall correctness, while the F1 score balances precision and recall, making it more robust for imbalanced datasets. - When should I use the F1 score instead of accuracy?
Use the F1 score when dealing with imbalanced datasets or when both precision and recall are important. - What are the F-score variants?
Variants include the F2 score (emphasizing recall) and the F-beta score (allowing dynamic balancing of precision and recall). - How can I improve the F1 score of my model?
Improve data quality, address class imbalance, and tune model parameters to balance precision and recall. - Where can I learn more about the F1 score and other machine-learning metrics?
Visit LEARNS.EDU.VN for detailed guides, courses, and resources on machine learning evaluation metrics.
Unlock deeper insights and master machine learning metrics with LEARNS.EDU.VN! Discover a wealth of resources designed to elevate your skills and knowledge. From comprehensive guides to expert-led courses, LEARNS.EDU.VN is your ultimate destination for continuous learning and growth.
Ready to take your understanding to the next level? Visit LEARNS.EDU.VN today and explore our extensive collection of articles and courses. Let us guide you on the path to becoming a proficient machine learning practitioner. Don’t miss out—start your journey now!
Address: 123 Education Way, Learnville, CA 90210, United States
WhatsApp: +1 555-555-1212
Website: learns.edu.vn